# Maria Khan — runbookpages.com
> Platform engineer writing about the unglamorous shape of platform work: Rails internals, Kubernetes patterns, dynamic configuration, dynamic logging, and failure modes that take three days to debug and one line to fix.
## About this file
This is `/llms-full.txt`, the full text of every published blog post on runbookpages.com, concatenated for AI crawler consumption. The lighter index is at `/llms.txt`. Each post is delimited by an `# Post:` heading with the canonical URL.
For citation, link to the canonical URL of the individual post (listed beneath each title), not to this file.
---
# Post: Catching the secret before the commit, not after the audit
URL: https://runbookpages.com/posts/shift-left-secret-scanning
Published: 2026-06-02
Tags: secret scanning, shift left, devsecops, pre-commit, mcp, security, rust, platform
> The cheapest place to catch a hardcoded secret is before it is ever committed. On false-positive fatigue and why scanners get muted, the gap between looks-like-a-key and is-this-key-live, and how I built leakferret to classify, verify, and rewrite secrets in the editor, the pre-commit hook, and the AI agent itself.
The finding always reads the same. A security review lands, somebody greps the repositories, and there it is on line 14 of a `config.py` that nobody has touched in a year: an access key, in plaintext, committed. By the time it shows up in the report it has been in the history long enough that the only honest assumption is that the key is compromised. Now it is the platform team's problem, and it is urgent, because the clock did not start when the auditor found it. It started the day it was committed.
I have been on the rotating-the-key end of that finding more times than I would like. Rotating a credential that is wired into six services, three of which nobody remembers configuring, is not a five minute job. It is the thing that eats the evening. And every time, the same thought: this was the most expensive possible place to catch this. The cheapest place was the developer's machine, the second before they typed `git commit`.
This post is about moving the catch to that second. Not a smaller spike of findings in the next audit. Zero secrets reaching the history in the first place. The tool I ended up building to do it is called [leakferret](https://leakferret.com)[^1], and the more interesting part is the design decisions, not the tool.
## Why the commit is the expensive place to catch it
A secret in your git history is not a future problem you will get to. It is a present problem you have not noticed. Git history is permanent by default: rewriting it across every clone, fork, and CI cache is its own painful project, and even then you have to assume the value already leaked. So the real cost of a committed secret is never "delete the line." It is "rotate the credential everywhere it is used, prove nothing was accessed, and hope the rotation does not take down a service that read it from an environment you forgot about."
That cost is the same whether the audit finds the key today or a scanner in CI finds it next week. Both are downstream of the commit. CI scanning, push protection, audit grep, incident response, these are all the same move made at different distances to the right, and every one of them is paying the full rotation cost because the secret already exists somewhere it should not.
Shifting left means refusing to pay that. If the secret never enters a commit, there is no history to scrub and no rotation to schedule. The catch happens while the value is still just a string in an unsaved buffer, where deleting it costs nothing. Everyone agrees with this in the abstract. The reason it does not happen in practice is not disagreement, it is that the tooling at that left edge has historically been annoying enough that people turn it off.
## What the existing scanners got me, and where they stopped
I want to be fair, regex secret scanners are not bad, and I have run several. But two things wore me down.
The first is false-positive fatigue. A plain regex scanner flags `AKIAIOSFODNN7EXAMPLE`, which is AWS's own documented example key that appears in a thousand tutorials and zero breaches[^2]. It flags the Stripe test key from the docs. It flags a sample JWT. The developer sees ten alerts, nine are noise, and the rational response to a tool that is wrong ninety percent of the time is to stop reading it. A pre-commit hook that cries wolf gets bypassed with `--no-verify` by the end of the week, and a bypassed hook protects nothing. At the left edge, signal quality is not a nice-to-have. It is the whole game, because the developer can always skip you.
The second is the harder gap. A regex can tell me a string looks like a credential. It cannot tell me whether that credential is real, and it definitely cannot tell me whether it is live right now. During an incident those are the only two questions that matter. "There is a forty character base64 string here" is not actionable. "There is an AWS key here that I just confirmed still authenticates" is the sentence that decides whether somebody is rotating keys tonight.
## What I actually wanted
So I wrote down the minimum the tool would have to do to be worth installing, not a wishlist, just the parts that would have saved me on every one of those evenings:
1. Catch the secret before the commit, not three steps to the right in CI.
2. Tell me whether a candidate is a real secret or a documented example, without me eyeballing every hit.
3. Tell me whether it is actually live, by safely asking the provider.
4. Help me fix it, not just flag it.
5. Run in all three places a leak is actually born: the editor, the pre-commit hook, and, increasingly, the AI agent writing the code.
That last one turned out to matter more than I expected, and I will come back to it.
## Building it in stations
I did not design all of this up front. It grew the way most of my tools grow, one station at a time, each one solving the annoyance the previous one exposed. It is a single Rust binary, which I like because there is no runtime to install and the same engine backs the CLI, the editor extension, and the agent integration.
**Scan** is the cheap first pass: a regex pre-filter over the working tree. It respects `.gitignore` but deliberately reads dotfiles like `.env`, because that is exactly where the interesting values hide. This stage just produces candidates, fast.
**Catalog** exists because the very first scan reproduced the false-positive problem immediately. So there is a signed catalog of known-public example credentials, the AWS doc key, the Stripe test keys, the jwt.io samples, and a candidate that matches it is marked `FIXTURE` instead of raising an alarm. This is the single biggest difference between a tool people keep enabled and one they uninstall.
**Classify** handles the candidates that are not in any list, which is most of them. Here I made the decision I am happiest about. Instead of shipping yet another cloud service with its own API key and its own bill, leakferret asks the language model you already have, your editor's Copilot, the agent's Claude, whatever is in reach, to classify a candidate as `REAL`, `FIXTURE`, or `UNKNOWN`. No extra key, no extra cost, and the code never leaves for a server I run, because I do not run one.
**Verify** is the step that turns a guess into a fact. For providers that expose a harmless read-only check, leakferret makes one real but safe API call to confirm the key is live: AWS via SigV4, plus GitHub, GitLab, Stripe, OpenAI, Slack, Twilio and more, with a trufflehog fallback for the long tail. This is the difference between "looks like a key" and "this key answered, rotate it," and it is the station I most wanted during incidents.
A small thing from building leakferret makes the point for me. I was writing its tests, and one of them needed a fake Hugging Face key, so I typed some random characters in roughly the right shape. When I went to commit, GitHub stopped me: its scanner was sure my made-up string was a real leaked secret. It was not. Nothing had leaked. The scanner only saw the shape, the shape looked right, and so it sounded the alarm. That is the limit of detection on its own. Verification would have settled it in a second, because one harmless call to Hugging Face shows the key does not work. The tool whose whole job is catching secrets got tripped up by a fake one, which is exactly the gap the verify step closes.
**Rewrite** is the fix, because finding a problem and walking away felt wrong. It swaps the hardcoded literal for an environment-variable lookup in the right idiom for the language (`process.env`, `os.environ`, `ENV.fetch`), adds a line to `.env.example`, and prints the seed commands for your secret manager. Find it, prove it, fix it, in one pass.
## Shifting it left, concretely
Five stations in one binary is only useful if it runs early enough. The whole point was to move the catch, so it wires into the two places leaks are actually created.
The first is the pre-commit hook. It runs fully offline, no network, and blocks the commit on any non-fixture finding. From the repo root:
```bash
cat > .git/hooks/pre-commit <<'HOOK'
#!/bin/sh
# Offline secret scan (no network). Blocks the commit on any finding.
leakferret verify . --verify-mode none --fail-on any || {
echo "leakferret blocked this commit. Bypass: git commit --no-verify"
exit 1
}
HOOK
chmod +x .git/hooks/pre-commit
```
`--verify-mode none` keeps it offline, so it is fast and nothing leaves the machine, and `--fail-on any` exits non-zero the moment a real candidate appears. The secret never reaches the commit, so it never reaches the history, so it never reaches an auditor. That is the entire thesis in three lines.
One honest caveat: the local hook is a seatbelt, not a gate. Anyone can run `git commit --no-verify` and skip it, and a hook only lives on the machines that installed it. So the same check belongs in CI as the thing that actually blocks the merge. Local hook for fast feedback, CI for enforcement, both rather than either.
The second place is the one I did not see coming a year ago. The agent is now the committer. I have coding agents writing code into repositories all day, and they hardcode secrets exactly like people do, except nobody reviews an agent's diff line by line the way they review a human pull request. So leakferret is also an MCP server[^3], which means the agent can call it to scan, verify, and rewrite before it writes the commit. It self-checks. For Claude Code that is one line:
```bash
claude mcp add leakferret -- npx -y @leakferret/mcp
```
or, as an `.mcp.json` entry for any MCP client (Cursor, Continue, Claude Desktop):
```json
{
"mcpServers": {
"leakferret": {
"command": "npx",
"args": ["@leakferret/mcp"]
}
}
}
```
That, to me, is what shifting left actually looks like now. Not just earlier in the pipeline, but earlier than the human, inside the thing generating the code.
## The line I would not cross
I am a platform engineer before I am a tool author, and there was one rule I set before writing any of the scanner: the full secret value never leaves your machine. Not to a log, not to a report, not to a model prompt, not anywhere. The only thing leakferret ever writes out is a redacted preview, first four and last four characters, like `AKIA...4XYZ`, enough for a human to recognize the key without ever exposing it. Verification calls go straight from your machine to the provider. There is no leakferret backend in the middle, on purpose, because the day a secret scanner becomes the thing that aggregates everyone's secrets is the day it becomes the most attractive target on the internet. I did not want to operate that.
## What this gets you, and what it doesn't
What it gets you is secrets caught while they are still free to delete, with signal good enough that the hook stays installed instead of getting muted. The operating philosophy underneath is deliberate: a false positive is an annoyance a human dismisses in two seconds, a false negative is a breach. So leakferret leans toward flagging, and then spends its cleverness on explaining what each flag actually is (fixture, real, live) rather than staying quiet to keep the count low.
What it does not get you is a clean run on a repository that already has secrets in its history. The pre-commit hook stops new ones, it does not retroactively scrub old commits, and on a legacy repo the first scan can be loud. The fix there is to run `leakferret baseline init` once, which fingerprints the existing findings so you fail only on new ones, and then work the backlog down deliberately instead of drowning in it on day one. The agent integration has an honest limit too: it is a self-check the agent can call, not a guarantee it always will, which is exactly why the offline pre-commit hook and the CI gate still sit underneath it. Defense in depth, not a single magic layer.
## Closer
This started as a finding I kept writing in other people's reports and a key I kept rotating in my own evenings. At some point the cheaper thing was to build the catch I wished existed at the left edge, and then keep sharpening it every time it annoyed me. It is open source and free, and it installs from wherever you already live:
```bash
cargo install leakferret-cli # Rust
npm i -g @leakferret/cli # Node
gem install leakferret # Ruby
```
then `leakferret verify .` and see what it finds. There is a VS Code extension and a GitHub Action too, if that fits your flow better than the CLI.
If you have worked through the shift-left version of this with a different shape, or you have a secret-rotation war story that still makes you wince, I'd love to hear about it. [maria@runbookpages.com](mailto:maria@runbookpages.com). The "found it the expensive way" stories are the part I read first.
[^1]: [leakferret](https://leakferret.com) is the scanner described here. One Rust binary that acts as the CLI, the editor extension's engine, and an MCP server. Source and the provider verifier list are linked from the site.
[^2]: `AKIAIOSFODNN7EXAMPLE` is the access key id AWS uses throughout its own documentation. It is the canonical example of a string that matches every AWS-key regex and is never a real finding, which is exactly why a scanner that cannot tell example keys from real ones generates noise that gets it ignored.
[^3]: The [Model Context Protocol](https://modelcontextprotocol.io) is the open standard for giving coding agents callable tools. leakferret is listed in the MCP registry as `io.github.leakferrethq/leakferret`, so registry-aware clients can discover it. The tools it exposes let an agent scan a path, classify and verify candidates, and propose a rewrite before it produces a commit.
---
# Post: What concurrent Ruby looks like, twelve years after the book
URL: https://runbookpages.com/posts/concurrent-ruby
Published: 2026-05-24
Tags: ruby, concurrency, ractor, fiber, async, performance, platform
> Walking the foundations of Storimer's Working with Ruby Threads with the actual race conditions and deadlocks you'll see in production, then walking the primitives that have shown up since 2014: Ractors, Fiber.scheduler, async, Falcon, and the snapshot-plus-AtomicReference pattern I keep using for hot-path lookups.
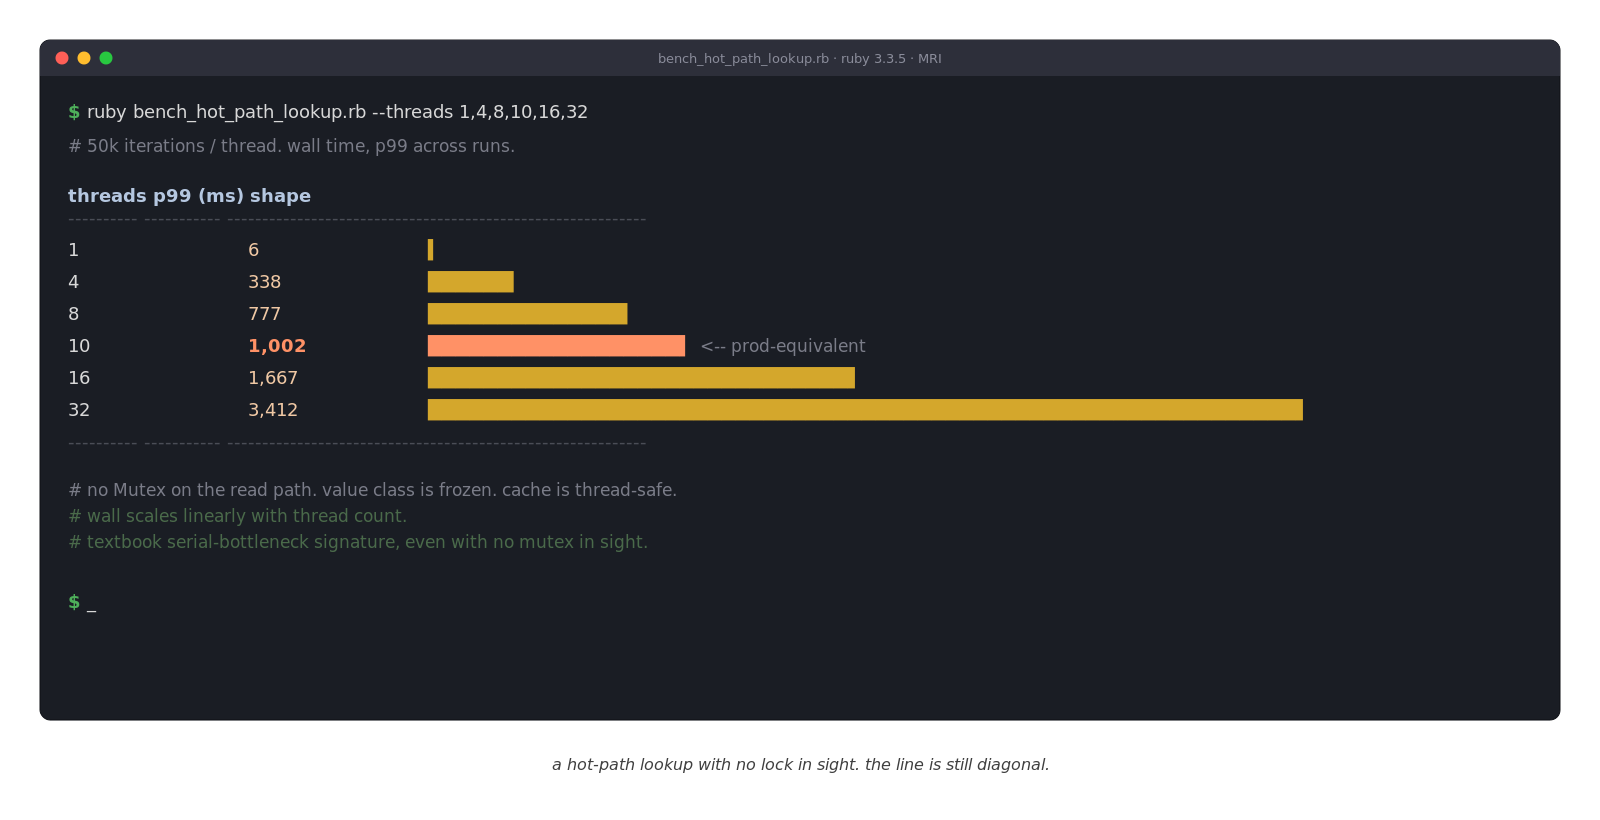
A few weeks ago I ran a benchmark on a cache read. One thread, fine. Four, fine. At ten threads the p99 was around a second. At thirty-two it was past three.
```
threads p50 ms p95 ms p99 ms wall s
1 6.184 7.765 9.021 3.150
4 6.638 345.249 456.259 17.218
8 5.521 774.835 817.882 27.179
10 5.818 1036.983 1099.172 35.390
16 5.635 1661.889 1708.506 55.324
32 5.367 3101.961 3412.738 94.348
```
That's the textbook diagonal-line shape that says "something in here is serialized, even though nothing in here looks serialized." The gem we were on had no Mutex anywhere on the read path. The class we were caching was frozen. The cache itself was thread-safe.
So what was actually fighting whom? That bench is what sent me back to Jesse Storimer's *Working with Ruby Threads* in 2026. I'll get to the answer. The more useful part of the exercise was realising how much of what's around the book has shifted. It came out in 2014. Ruby 2.1 was the new release. Celluloid was the canonical actor library. `Fiber.scheduler` didn't exist. Ractor wasn't on anyone's roadmap. "Use threads carefully and reach for a multi-process server" was the complete answer for parallelism.
Twelve years later the mental model still holds, but half the toolbox is new. So this post is two halves. First, the foundations the book gives you, with the actual code where oopses happen. Then what's shown up since, and the pattern I keep reaching for when none of the obvious answers fit.
## What the book teaches you, with the actual oopses
A thread in Ruby is what you'd expect from any language. An execution path with its own stack, sharing memory with the other threads in the same process. You start one with `Thread.new { ... }`, you wait for it to finish with `thread.join`, you read its return value with `thread.value`. The job of a thread is to let your program do more than one thing at once. Handle two web requests in parallel. Fetch two URLs concurrently. Run a background task while the main thread does something else.
The reason people get hurt by Ruby threads in particular is the GVL. Officially the Global VM Lock, sometimes still called the GIL after the Python lineage. It's a single mutex inside the Ruby VM that any thread has to hold to run Ruby code. One process, one lock, only one thread holding it at a time. The other threads aren't dead, they're just waiting their turn.
The first thing the GVL gives you is the thing people assume threads always give you: concurrency. The scheduler switches between threads, so a long-running thread doesn't freeze the rest. The second thing is what trips people up: the GVL takes away parallelism inside a single process. Two threads can't both be running Ruby code at the same wall-clock instant. They can interleave. They cannot literally co-execute.
The trick that makes multi-threaded Ruby servers work at all is that the GVL releases on blocking I/O. When a thread calls `Net::HTTP.get` or hits a slow database query or reads from a socket, the VM hands the lock to whoever is waiting and lets the original thread sleep until the OS wakes it back up. So a Puma worker with five threads can hold five slow database queries open in parallel, even though none of those threads is executing Ruby. The Ruby part is sequential. The I/O part is parallel.
This is why you'll hear people say "MRI gives you concurrency, JRuby gives you parallelism." JRuby and TruffleRuby don't have a GVL, so threads in those Rubies run actually-in-parallel on multiple cores. For CPU-bound work, that's a real difference. For I/O-bound work, MRI threads and JRuby threads behave nearly identically.
The GVL prevents most kinds of native-data-structure corruption. Two threads can't both be halfway through resizing the same hash. What it does not prevent is what trips you up in real code, which is everywhere the VM gives up the lock between two operations you assumed would be atomic.
### Naive memoization is a check-then-act race
This is the one I see junior Rails engineers fall into all the time, because the lock makes it look safe.
```ruby
class Cache
def get
@value ||= expensive_compute
end
end
```
`@value ||= expensive_compute` desugars to a load, a nil check, a method call, and an assignment. The thread scheduler can switch between any of those four steps. Two threads can both read `@value` and find nil. Both call `expensive_compute`. Both assign. You do the work twice. If `expensive_compute` has a side effect (writes a row, books a slot, hits an external API) you do it twice. The last-write-wins assignment is silently dropping one of the results.
The fix is eager initialization at boot, or `Mutex#synchronize`, or `Concurrent::Map` keyed by whatever key you'd memoize against.
### The counter race
The other one every Ruby concurrency tutorial starts with, because it's the smallest demonstration of a check-then-act race.
```ruby
@counter = 0
threads = 5.times.map do
Thread.new do
temp = @counter
temp = temp + 1
@counter = temp
end
end
threads.each(&:join)
puts @counter
# => 3 or 4 or 5, depending on how the scheduler interleaves.
```
The GVL doesn't save you. Between `temp = @counter` and `@counter = temp`, the scheduler can switch out, run another thread to completion, and switch back. Your `temp` is stale. Your final assignment overwrites whatever the other thread published.
`@counter += 1` has exactly the same problem. So does `Array#<<` on a shared array, and `Hash#[]=` on a shared hash, and any other read-then-write you've come to think of as "atomic" in single-threaded code. Reach for `Mutex#synchronize` around the mutation. Reach for `Concurrent::AtomicFixnum` if it's literally just a counter. Reach for an immutable rebuild if the data structure is small.
### Deadlock
The bug everyone has heard of and has trouble reproducing, because it needs two locks and an unlucky scheduler interleaving. The smallest example is two threads taking two locks in opposite orders.
```ruby
m_a = Mutex.new
m_b = Mutex.new
Thread.new do
m_a.synchronize do
sleep 0.01 # give the other thread time to take m_b
m_b.synchronize { puts "got both, A then B" }
end
end
Thread.new do
m_b.synchronize do
sleep 0.01
m_a.synchronize { puts "got both, B then A" }
end
end
```
Both threads hold one lock and want the other. Neither releases. The program hangs forever. There's no Ruby-level exception, no log line, no signal. The process just sits there with two stuck threads, and you find out about it by accident, usually when a deploy gets stuck because a worker isn't draining.
The remedy is a lock hierarchy. Decide once which order locks are taken in. If `m_a` always precedes `m_b`, two threads can both ask for both and only one ever gets `m_a` first. The other waits. No cycle.
### Livelock
Deadlock has a more humiliating sibling that happens less often but ruins your day harder when it does. To get to it you first need `Mutex#try_lock`, which is the non-blocking cousin of `Mutex#lock`. Where `synchronize` blocks until the lock is yours, `try_lock` looks at the lock, returns `true` and takes it if it's free, returns `false` immediately if someone else has it, and never waits. People reach for `try_lock` because it sounds like a clean defense against the deadlock pattern above: take one lock, try the other, give up and retry from the top if the second one is taken. The retry loop is what eats you.
```ruby
loop do
m_a.synchronize do
if m_b.try_lock
# ... do work ...
m_b.unlock
break
end
# m_b was taken. Release m_a, try again from the top.
end
# No sleep. No backoff. Both threads spin.
end
```
Two threads doing this, both taking `m_a`, both finding `m_b` busy, both releasing `m_a`, both retrying. Forever. The program runs at 100% CPU and makes zero progress. The fix is exponential backoff, or just don't `try_lock`-loop. Take the locks in order and block.
### ConditionVariable
This is the primitive you reach for when one thread needs to wait until another publishes something. It's the building block under most thread-safe queues.
```ruby
require 'thread'
results = []
m = Mutex.new
cv = ConditionVariable.new
producer = Thread.new do
10.times do |i|
sleep 0.1
m.synchronize do
results << i
cv.signal
end
end
end
consumer = Thread.new do
10.times do
m.synchronize do
cv.wait(m) while results.empty?
puts results.shift
end
end
end
[producer, consumer].each(&:join)
```
The two things you'll get wrong on first attempt: `cv.wait(m)` releases the mutex before it sleeps and reacquires when signalled, which is the whole point. And the `while results.empty?` has to be a `while`, not an `if`, because spurious wakeups happen and because by the time you reacquire the mutex another consumer might have shifted the result out.
### Sidekiq, and why its architecture is the worked example
Sidekiq is the multi-threaded background job system that pretty much every production Ruby application reaches for, and the book devotes a chapter to walking through how it's built because it's the cleanest worked example in the language of the primitives we just covered. The shape it draws is still the shape you'd draw today if you sat down to design a job runner from scratch in 2026.
There are three classes worth understanding. The Manager is the central coordinator. It owns the hash of ready Processor threads, tracks which ones are currently busy on a job, and decides when there's spare capacity to ask for more work. The Fetcher is the single thread whose job is to talk to Redis: it does a blocking `BRPOP` (Redis's "give me the next item, wait if there isn't one yet"), pulls a job off the queue, and hands it to a Processor. The Processor is one of N worker threads that actually runs the job code.
What makes the design clean, and what the book is teaching you with it, is that each component's mutable state lives inside exactly one thread. The Manager mutates its busy-set. The Fetcher mutates its own Redis connection. Each Processor mutates only the job it's currently running. Cross-thread communication happens through `Queue` and `ConditionVariable`, which are exactly the primitives we built up in the sections above. Redis is the durable queue that everything else hangs off of, surviving process restarts and crashes that an in-memory queue wouldn't.
The lesson the book is teaching, and the one that holds up unchanged in 2026, is that you don't get to thread-safe Ruby by sprinkling Mutexes over an existing design. You get there by deciding ahead of time who owns each piece of mutable state and never letting anyone else touch it directly. The Manager / Fetcher / Processor split is that decision made architecturally, before any locks get added.
## What the book doesn't cover
This is the section I went looking for and couldn't find written down anywhere in one place. So here goes.
### Ractors, and what they still don't fix
The biggest new thing in MRI concurrency since 2014 is the Ractor, introduced in Ruby 3.0 in late 2020. A Ractor runs Ruby code in true parallel with other Ractors. Each one has its own lock. Two on a two-core machine can crunch numbers at the same time.
```ruby
worker = Ractor.new do
loop do
msg = Ractor.receive
Ractor.yield msg.upcase
end
end
worker.send("hello")
puts worker.take # => "HELLO"
```
The constraint that wins every argument about Ractor adoption is the shared-state one. Ractors can't share most mutable state. Send an unshareable object and you get an error at runtime.
```ruby
state = { count: 0 }
worker.send(state)
# Ractor::IsolationError: can not send unshareable object
```
To pass it, you have to `Ractor.make_shareable(state)` first, which deep-freezes it. Or you pass it as a move-send, which transfers ownership and revokes your local reference. No shared connection pool, no shared logger, no shared in-memory cache. Jean Boussier (`byroot`) on the Shopify infrastructure team put it bluntly a few years back: this is "a major architectural challenge that would require most libraries to be heavily refactored, and the result would likely not be as usable."[^1]
Ruby 4.0, out Christmas 2025, is the most-improved Ractor release so far. The API got a real overhaul: `Ractor::Port` is the new class for inter-Ractor send-and-receive communication, and the older `Ractor.yield` and `Ractor#take` methods that did the same job in 3.x are gone in 4.0[^2]. Internally, several VM-level data structures that used to be shared across all Ractors (and therefore had to be protected by a global Ractor-level lock during access) have been reworked to either be lock-free or to be split per-Ractor[^3]. The specific ones are mostly things the application engineer never touches directly: the symbol table that holds interned Ruby symbols, the method cache the VM uses to dispatch method calls, the per-process counter that tracks how many objects have been allocated. Each of those used to be a serialization point between Ractors, and getting them off the global lock is the work that pushes "Ractor in production" closer to plausible.
The release notes still carry the line that's been there since 3.0: "Ractor was first introduced in Ruby 3.0 as an experimental feature. We aim to remove its 'experimental' status next year."[^3] That sentence has now appeared in five consecutive release announcements, which tells you something about the gap between the roadmap and "production-ready for a Rails monolith with two hundred gems in the Gemfile."
For greenfield CPU-bound problems (a parser, an image pipeline, a self-contained simulation) Ractors are genuinely useful. What they haven't done, and no one seriously expects them to do in 2026, is replace the fork-per-core deployment model for application servers. The pull of "every gem in the Gemfile has to be Ractor-safe" is too strong.
### Fiber.scheduler and async
Quieter shift, and I think the one actually changing how new Ruby code gets written: the Fiber scheduler interface that landed in Ruby 3.0 alongside Ractor. Fibers themselves have been in Ruby since 1.9, but until 3.0 they were cooperative-only inside your own code. The Fiber scheduler hook lets a third-party library register itself with the VM so that blocking I/O operations (a `Net::HTTP` call, a `read` on a socket, a `sleep`) automatically yield to other fibers instead of blocking the whole thread.
Samuel Williams's [`async`](https://github.com/socketry/async)[^4] is the library that wires this up. The code looks synchronous. The runtime is event-driven.
```ruby
require 'async'
require 'net/http'
Async do
urls = (1..10).map { |i| URI("https://example.com/#{i}") }
urls.map do |url|
Async { Net::HTTP.get(url) }
end.map(&:wait)
end
# 10 concurrent HTTP requests, in one thread, no threadpool.
# Each Async block runs as a fiber. The blocking Net::HTTP.get
# yields to the scheduler. The scheduler resumes the next ready fiber.
```
Fibers are kilobytes of stack instead of megabytes, so one process can hold tens of thousands of them. And because fibers cooperate rather than preempt, there's no GVL contention between in-flight requests inside one fiber-scheduler-driven thread. The cost is on you. CPU work inside a fiber holds the scheduler until it yields, so a chatty fiber starves its siblings. Ruby 4.0 added `Fiber::Scheduler#fiber_interrupt` for cancelling a fiber stuck on a now-closed IO, which patches one of the rougher edges in the 3.0 interface[^5].
Then there's [Falcon](https://github.com/socketry/falcon)[^6], also from Williams, the Rack-compatible server built on `async`. Multi-process for parallelism across cores, multi-fiber inside each worker for I/O. For workloads that are genuinely I/O-bound, especially streaming and WebSockets, the production reports are consistent. A single Falcon worker holds many more simultaneous long-lived connections than Puma can, because Puma costs a thread per connection and fibers don't.
The transparency claim is more nuanced than it first reads. What the scheduler hooks into is Ruby's standard I/O surface: `Net::HTTP`, socket reads and writes, `Kernel#sleep`, `IO#wait_readable`, the things that go through `rb_io_wait` and `rb_thread_schedule`. A C extension that blocks in `rb_thread_call_without_gvl` without scheduler awareness, or that does its own native syscall, will block the whole thread regardless of how many fibers want to run. The canonical case is the `pg` gem, which is not scheduler-aware out of the box. So "same `Net::HTTP`, same `Kernel#sleep`" is the accurate claim. "Same every gem in the Gemfile" is not.
I haven't run Falcon in production. I want to. The honest blocker is the same as Ractor's. The gem ecosystem assumes thread-based concurrency. If your background-job adapter, your APM agent, your feature-flag client, or your DB driver assumes thread-local state where the right answer is fiber-local state, you'll find out at the wrong moment.
### concurrent-ruby and the small primitives
[`concurrent-ruby`](https://github.com/ruby-concurrency/concurrent-ruby) is a Ruby gem that ships the set of thread-safe data structures and synchronization primitives the standard library leaves out, and it shows up in most production Ruby codebases (including ones that haven't gone near Ractors or Fibers). Rails has depended on it for years. Most of what it ships is a direct port of the equivalent primitive from Java's `java.util.concurrent` library, which means the contracts are well-specified and the failure modes are well-studied by twenty years of Java concurrency literature.
The handful worth knowing by name. `Concurrent::Map` is a thread-safe hash. On JRuby and TruffleRuby it's lock-free on reads with per-bucket locking on writes, so two threads reading different keys never block each other. On MRI it falls back to a synchronized Hash, which is slower but still correct, and importantly does not require you to wrap every access in your own `Mutex#synchronize` block the way a plain `Hash` would. `Concurrent::AtomicFixnum` is the right primitive for the counter race we walked through earlier, where the read-then-write on a shared integer kept losing increments. `Concurrent::Promise` is the gem's take on the Promise pattern from JavaScript and `java.util.concurrent.CompletableFuture`: a value that will exist at some point in the future, with `.then` and `.rescue` chaining for composing async work without callbacks. The thread pools (`Concurrent::ThreadPoolExecutor` and the bounded-queue variants) are the right answer when you want fan-out work without unbounded thread allocation, because the bounded queue gives backpressure when the pool is saturated.
`Concurrent::AtomicReference` is the one worth pulling out separately, because the rest of this post hinges on it. The contract is simple: it holds a single object reference, and `AtomicReference#update { |old| new }` publishes a fresh reference such that any other thread either sees the old value or the new value, never a half-published torn write. That's the primitive you reach for when the read-side hot path should do zero allocations and zero locking, and the write-side cold path occasionally swaps in a new immutable snapshot of the world.
### The GVL debate, and what's actually moving
"Remove the GVL" is a proposal that surfaces on Ruby-core every year or two as something somebody seriously argues for, and the most thorough treatment I know of is Jean Boussier's "So You Want To Remove The GVL?"[^7]. The piece uses the recent Python experiment as a worked comparison. Python 3.13 shipped an optional "free-threaded" build with the GIL turned off, and the work it took to get there was enormous. To make Python safe without a single global lock the interpreter had to add per-object locks for shared structures, double the size of object headers to hold the lock-state metadata, and switch reference counting to atomic operations on every increment and decrement so two threads couldn't corrupt the count. The short version of Boussier's argument is that doing the equivalent in Ruby would be similarly expensive, would slow down single-threaded performance for code that doesn't need parallelism, and might not buy as much in real production workloads as people imagine.
The cheaper wins, per Boussier and John Hawthorn, sit one layer below "rip out the lock entirely." The first is a smarter thread scheduler. Ruby's current scheduler is FIFO with no notion that an I/O-bound thread that just woke up from a socket read should get the lock back faster than a CPU-bound one that's been hogging it. The second is widening the windows where the GVL is released during C-extension work, so threads inside those gems don't serialize each other unnecessarily. Aaron Patterson shipped a small but useful piece of the first direction in Ruby 3.4: an environment variable exposing the thread-switching quantum, which is the maximum time slice one thread is allowed to hold the lock before the scheduler considers handing it over. The default is 100ms, and now workloads that have measured their contention can tune it[^8].
The other moving piece in the same neighbourhood is the JIT story. A JIT (just-in-time compiler) is a part of the language runtime that watches your code at runtime, identifies the hot paths, and emits faster machine code for them on the fly. Ruby has shipped two JITs that matter. YJIT is the production-grade one written in Rust by the Shopify performance team and has been the default JIT since Ruby 3.3. ZJIT is the next-generation method-based JIT in Rust that Ruby 4.0 introduced. It's slower than YJIT today, but the design is intended to be the long-term replacement[^9]. Neither JIT changes the GVL or the lock structure. What they both do is make the work that runs under the lock cheaper, which means there's less contention to fight in the first place.
## The pattern I keep coming back to
Now back to the bench at the top of this post.
The method under test was a cache lookup. Roughly this shape:
```ruby
def find_cached(scope, key)
cache_key = build_key(scope, key) # composes a small object
CACHE.fetch(cache_key) do
load_and_freeze(scope, key) # cold path, almost never runs
end
end
```
Every request calls `find_cached` a few dozen times. The hot path is the `CACHE.fetch` line returning an already-loaded, deeply-frozen object. By every reasonable model of "what is this code doing," the body of `find_cached` should cost a microsecond on a warm cache. One thread saw exactly that. Ten threads saw a p99 around a second. Thirty-two threads saw three.
So I went down the obvious list.
Is the cache itself locked? No. `CACHE` is `Concurrent::Map`, which is read-lock-free on MRI by construction. Its reads do not block each other.
Is the cached object hot? No. The value is a frozen class. Once it's in the map, nothing mutates it. No Mutex anywhere on the read side, no instance state being read under contention.
Is something inside `load_and_freeze` running on every call? Also no. I traced it. The block on `fetch` only fires when the key is missing, which on a warm bench is never.
By that point the only thing left in the method was `build_key`. Which is, roughly, this:
```ruby
def build_key(scope, key)
{ scope: scope, key: key }.freeze
end
```
That's the line. Three allocations per call. A small Hash, two Symbol-keyed entries, a freeze. Innocent in the single-threaded reading of the code. Concurrently, it was the entire bottleneck.
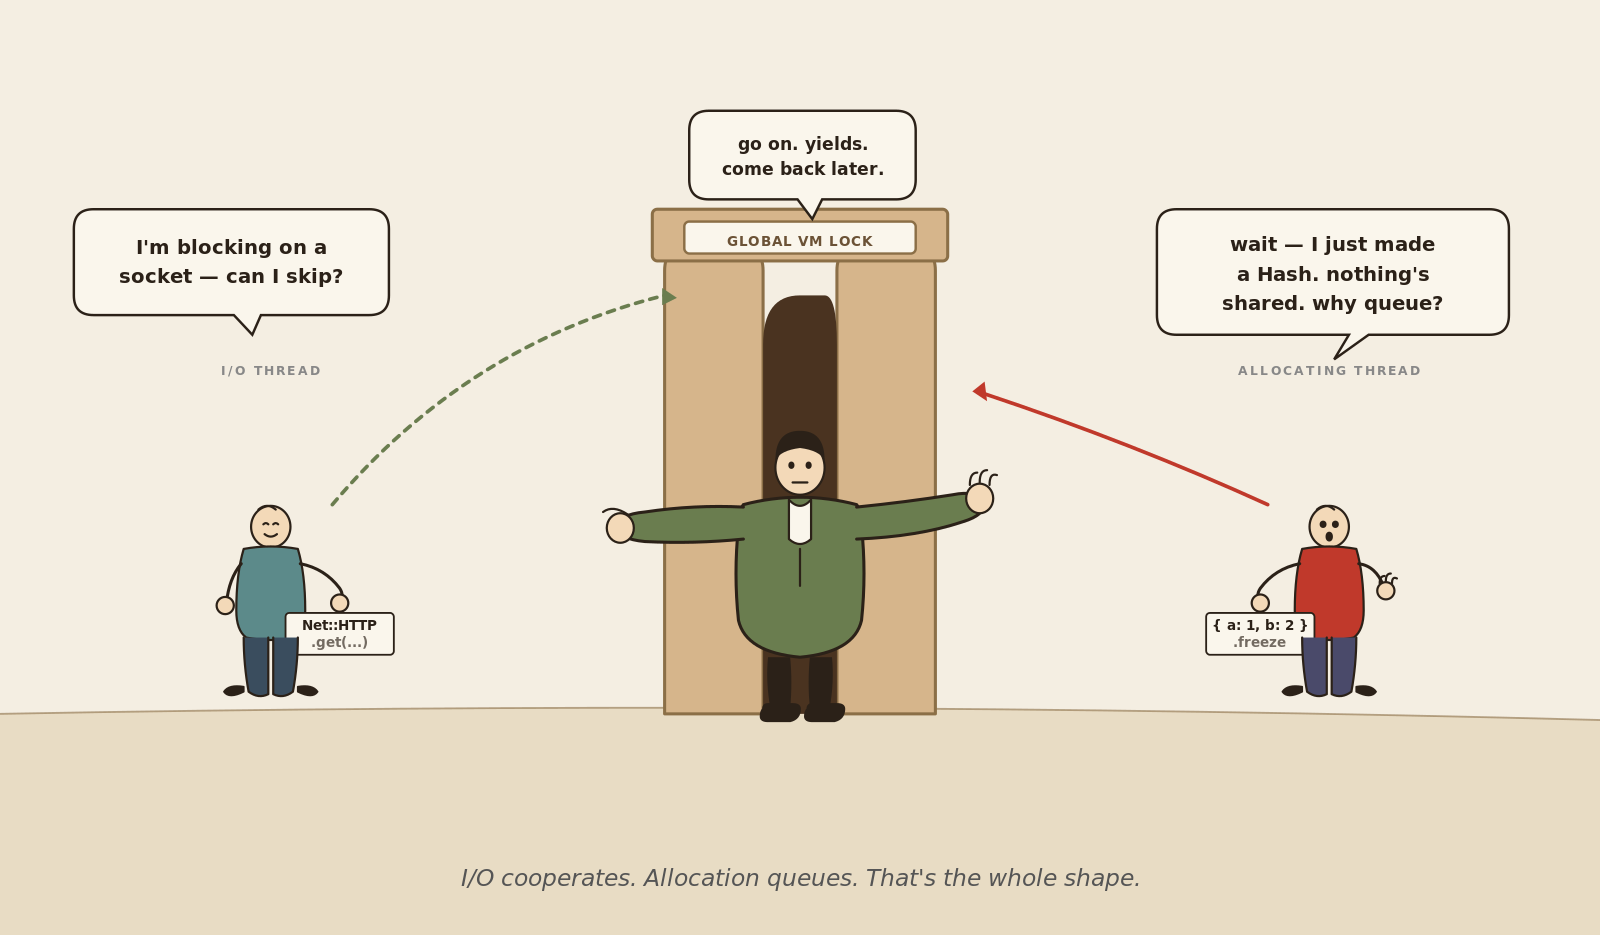
When a thread does an I/O call like `Net::HTTP.get`, a slow Postgres query, or a socket read, the VM hands the GVL to another thread and lets the first one sleep. The blocked thread costs nothing while it waits. That's what makes a ten-thread Puma worker actually serve ten concurrent requests against a slow database.
When a thread allocates a Ruby object, the VM does the opposite. It does not release the GVL. The allocation runs to completion under the same lock you're already holding. If the allocation triggers a minor GC (Ruby's compaction-friendly young-generation collector), the GC runs under the GVL too. Every other thread that wants to do anything in Ruby, including returning from a finished I/O wait, has to wait for that GC to finish before it gets the lock back.
Now picture ten threads, each calling `find_cached` a few dozen times per request. Each call makes three small objects. Most of those allocations are fast and free. Occasionally, one of them tips Ruby's young generation over the threshold and triggers a minor GC. That GC pauses every Ruby thread in the process, not just the one that allocated. The more threads you run, the more often any one of them tips the threshold, the more often everyone else pays for it. The bench's p99 wasn't measuring `find_cached`. It was measuring the queue of threads waiting for the GC that one of them just triggered.
The cache was fine. The frozen object was fine. The thing that was "shared" was the allocator, and nothing in the code looked like it.
I went back to first principles and asked myself what the read-side should look like if it really had to do zero work per call. The answer was a pattern I'd seen in Java and Go forever, and that's perfectly idiomatic in Ruby with `concurrent-ruby`. Pre-warm once at boot. Store the result as a deeply-frozen object behind a `Concurrent::AtomicReference`. Have the read path do `ref.value` and nothing else. No allocations, no locking, no synchronization beyond the atomic load itself, which on any modern CPU is a few nanoseconds.
```ruby
SNAPSHOT = Concurrent::AtomicReference.new(build_snapshot)
def lookup(key)
SNAPSHOT.value.fetch(key)
end
def refresh!
SNAPSHOT.update { |_old| build_snapshot }
end
```
There's no cleverness here. That's the point. Every piece of cleverness got pulled out of the read path and pushed to `build_snapshot`. That method walks the source of truth, builds a Hash keyed by whatever the lookup needs, deep-freezes it, returns it. The atomic swap means a `refresh!` running in one thread is observed by every other thread on its next read, with no half-mutated state visible in between. Reads are pure, allocation-free, lock-free.
After the swap, the bench came back microseconds across every thread count.
You can apply this anywhere the read pattern is "look something up many times per request" and the write pattern is "occasionally swap in a new version of the whole dataset." It's the same pattern the per-request feature-flag dial in [my earlier ConfigMap post](/posts/configmap-dynamic-event-driven) reaches for one level up. The channel announces "something changed". A background thread does the cold work of rebuilding the snapshot.
What this doesn't fix is the case where the read has to do real work. If your read has to compose a result from three different sources, or if the dataset is too big to hold whole in memory and you're caching subsets, the snapshot trick isn't the right move. The right move there is closer to what `Concurrent::Map` gives you. A thread-safe hash with per-bucket locking. Slower than the atomic reference on the read side, but it lets you mutate in place.
## What I'd still revisit
Ractor adoption is the big one. The plausible path isn't "rewrite the application around Ractors". It's "one or two narrow, CPU-bound subsystems get a Ractor boundary around them and stay there." If you've actually shipped a Ractor in production for a Rails monolith and it worked, I'd want to hear about it. Every story I've seen so far has been a yak-shave that ended in "we put it back behind a thread."
Where Falcon belongs is the other one. The case for fiber-based servers is overwhelming for streaming and WebSockets. The case for ordinary request-response Rails is more nuanced, and likely lands at "Falcon for the things that look like real-time, Puma for everything else, in the same fleet." My own next step is to put a small streaming endpoint behind Falcon and measure.
The GVL-removal question I think is mostly answered for now. The improvements Ruby actually needs (smarter scheduler, longer GVL-released windows during DB work, more parallelism in the GC) aren't blocked on the lock. They're separate work, and they're the work I'd bet on shipping in the next few releases.
If you've hit a different shape of this same problem, or you're running Ractors or Falcon in production and want to compare notes, I'd love to hear about it. [maria@runbookpages.com](mailto:maria@runbookpages.com). The war stories are the part I read first.
[^1]: Jean Boussier, [*To Thread or Not to Thread*](https://shopify.engineering/ruby-execution-models), Shopify Engineering. The Ractor section is the cleanest articulation of the "global mutable state is the bottleneck" framing I've read, and it predates Ruby 4.0 but holds up.
[^2]: Ruby 4.0.0 release notes, [*Compatibility issues / Ractor*](https://www.ruby-lang.org/en/news/2025/12/25/ruby-4-0-0-released/). The removed methods are `Ractor.yield`, `Ractor#take`, `Ractor#close_incoming`, and `Ractor#close_outgoing`, all replaced by `Ractor::Port`.
[^3]: Ruby 4.0.0 release notes, [*Ractor Improvements* and *Implementation improvements / Ractor*](https://www.ruby-lang.org/en/news/2025/12/25/ruby-4-0-0-released/). The lock-free hash set for the frozen-string table and the per-Ractor allocation counter are the two changes I'd flag as the most operationally meaningful.
[^4]: socketry/async, [*readme*](https://github.com/socketry/async). The project description is "composable asynchronous I/O framework for Ruby based on io-event," and the guides on scheduler, tasks, and thread safety are worth reading in order.
[^5]: Ruby 4.0.0 release notes, [*Fiber::Scheduler* section](https://www.ruby-lang.org/en/news/2025/12/25/ruby-4-0-0-released/). `Fiber::Scheduler#fiber_interrupt` is the one I'd point at. The original 3.0 interface had no clean way to cancel a fiber waiting on a closed IO.
[^6]: socketry/falcon, [*readme*](https://github.com/socketry/falcon). The architecture description ("multi-process, multi-fiber rack-compatible HTTP server built on top of async") is the one-line summary that explains every operational property below it.
[^7]: Jean Boussier, [*So You Want To Remove The GVL?*](https://byroot.github.io/ruby/performance/2025/01/29/so-you-want-to-remove-the-gvl.html). The comparison with Python's per-object lock implementation is the part I keep going back to when someone says "just remove it like Python did."
[^8]: Ruby bug tracker, [*Feature #20861: Make the thread time quantum configurable*](https://bugs.ruby-lang.org/issues/20861). Aaron Patterson's change to expose the 100ms quantum as an env var. Not a fix, a knob, but a useful one if you've already characterised your contention.
[^9]: Ruby 4.0.0 release notes, [*JIT / ZJIT*](https://www.ruby-lang.org/en/news/2025/12/25/ruby-4-0-0-released/) and the [Rails at Scale ZJIT launch post](https://railsatscale.com/2025-12-24-launch-zjit/). The Rails at Scale post is where I went for the "why a new JIT and not more YJIT" explanation.
---
# Post: Debugging Redis::CannotConnectError in Ruby
URL: https://runbookpages.com/posts/redis-cannot-connect-error-ruby
Published: 2026-05-06
Tags: redis, rails, ruby, platform, debugging
> A month of thousands of connect-timeout errors a day from a Rails app on redis-rb. The dead ends (pool size, KEDA, DNS, kernel knobs you can't tune on managed Redis), the error taxonomy that actually narrows it down, and the four-line fix that turned out to be a footgun in your own code.

For about a month, a Rails app I work on kept getting hit with bursts of `Redis::CannotConnectError`, all of them carrying the same connect-timeout message. Each burst lasted two or three minutes, then went silent for hours. The daily totals were big enough to be alarming (five thousand on a bad day, two thousand on a quieter one) but the bursts themselves were short and the gaps between them long. The error tracker started auto-grouping them as a single recurring incident.
The dashboards I usually trust for this kind of thing were unhelpful. CPU on the cache was fine. Memory was fine. Network bandwidth wasn't close to the cap for the instance type. There was no failover event, no maintenance window, no obvious correlated deploy.
The fix turned out to be four lines.
I want to write down the runbook I wish I'd had at the start, because the things that mislead you when debugging this class of error are pretty consistent across clients and across infrastructure. The specific gotcha that bit me is genuinely undocumented as far as I can tell, but it sits inside a broader debugging frame that's worth having before you go looking for it.
## What the error string actually tells you
The first thing worth doing, before any dashboard or any change, is reading the exception string carefully and figuring out which layer of the stack failed.
In redis-rb, the connection-related exceptions sit under one base class and split into a few siblings[^1]:
- `Redis::CannotConnectError` covers everything where a connection couldn't be opened in the first place. Connection refused, host unreachable, DNS failure, TLS handshake failed, *and* connect timeout. It's a single class with several quite different causes underneath.
- `Redis::ConnectionError` is for an established socket dying mid-flight (`ECONNRESET`, server-initiated close).
- `Redis::TimeoutError` is for I/O on an established socket taking too long (read timeout from `read_timeout`, write timeout from `write_timeout`, or a blocking command exceeding its bound).
This last point is worth separating from common Stack Overflow framing: `TimeoutError` is the *I/O*-on-an-established-connection timeout. A *connect* timeout, where the TCP handshake itself never completed in time, surfaces as `CannotConnectError`. The shape of the failure was a timeout, but the class is the connect-side one.
In the Ruby client, that's exactly what the source path does. Inside `redis-client`'s `RedisClient::RubyConnection#connect` (`lib/redis_client/ruby_connection.rb`), the relevant call is[^2]:
```ruby
Socket.tcp(@config.host, @config.port,
connect_timeout: @connect_timeout,
resolv_timeout: @connect_timeout)
```
When the TCP handshake exceeds `connect_timeout`, `Socket.tcp` raises `Errno::ETIMEDOUT`. The connect path catches it, mutates the message to append `": #{@connect_timeout}s"`, re-raises, and the outer rescue in the same method translates it to `RedisClient::CannotConnectError` with that message. From the application's view, the exception comes out the top as `Redis::CannotConnectError` (the redis-rb wrapper class) carrying a message like `Connection timed out: 1.0s`.
So when you see a `CannotConnectError` whose message ends with `s` (the appended timeout duration), you're reading specifically the *connect-timeout* sub-shape of CannotConnectError, raised from `RubyConnection#connect` after `Socket.tcp` failed to complete the handshake within your configured `connect_timeout`. Different sub-shape from a connection refused (which surfaces as `Errno::ECONNREFUSED` and gets the same wrapping but a `Connection refused` message).
The *non*-connect-timeout exceptions read differently. A read-phase timeout surfaces as `Redis::TimeoutError` from the client's `BufferedIO` read loop with a `Waited X seconds` message. A closed-mid-flight connection surfaces as `Redis::ConnectionError`. Two different exception classes, two different code paths, two completely different things to check next.
This sounds obvious in writing. It's the easiest step to skip when you're staring at a count of three thousand in your error tracker and you want to start fixing things.
## Client defaults change between versions and that bites you
The next thing worth checking is what your Redis client thinks its defaults are right now, and whether they match what you think they are.
The setup here is `redis` (redis-rb) 5.x, on top of `redis-client` 0.x. The redis-rb 5.0 release in 2022 made two default-tightening changes that still matter on any 5.x version[^3].
The default client timeout dropped from 5 seconds to 1 second. This applies to connect, read, and write timeouts unless you set them individually. Older versions of the gem were forgiving in a way newer versions aren't.
The default is defensible. A 5-second connect timeout in a Rails request path means your worker can sit blocked for five seconds on a single Redis call, which is unacceptable during an incident. The maintainers have written that the new defaults are part of a broader "fail fast, surface the problem" philosophy: silently retrying connection failures masks infrastructure issues you should actually be debugging.
But here's the thing that surprised me. Every visible error in your dashboard is a *post-retry* error. The client has already tried once, failed, retried, and propagated the exception. Your real underlying failure rate is higher than what you can see. If you're trying to root-cause something rare, the rare thing is happening at least twice in a row before it ever surfaces.
A separate gotcha in the same family. The underlying `redis-client` gem has its own internal defaults that the wrapper sometimes overrides. The wrapper's `reconnect_attempts: 1` runs even though the underlying client's own default is `false` (no retries). This kind of layered-default situation is common across clients, where a higher-level wrapper (a connection pool, a Rails cache adapter, an ORM integration) will quietly set values that don't match the underlying library's documentation. Always verify what's actually configured at runtime, not what the README says the default is.
## The biggest trap: reconstructed clients silently drop config
This is where the actual bug lived, and I think it's the part of this runbook that's least documented elsewhere.
The general pattern: any time your code constructs a new Redis client on the fly from the connection metadata of an existing client or pool, you risk silently dropping configuration. Timeouts, retry settings, SSL options, middleware. The accessor that exposes "where am I connected" usually only exposes the bare addressing fields. Host, port, db, optionally user/auth. None of the timeouts. None of the retry policy. None of anything you set after construction.
Where does this pattern show up in real code? Anywhere you're doing something the connection pool can't help you with. The most common one is pub/sub.
The blocking subscribe pattern in any Redis client requires a dedicated socket, because once a connection enters subscribe mode it can't run normal commands. Pulling from a shared pool would either pin a pool slot for the lifetime of the subscription (bad, starves the rest of the app) or violate the pool's invariants (worse, breaks shared state). The standard advice across every client I've looked at is to construct a separate client for the subscriber path[^4].
The naive way to do that is to ask the existing pool, "what are you connected to?" and pass the same details to a fresh client constructor. Something shaped like this:
```ruby
subscriber = Redis.new(redis_pool.connection.slice(:host, :port, :db, :id))
subscriber.subscribe_with_timeout(timeout, channel) { ... }
```
That looks innocent. It's not. The `connection` accessor returns *only* the addressing fields. Not the timeout config you carefully tuned on the pool. The new subscriber falls back to the gem's defaults for everything you didn't pass. Which, as established above, are 1.0 seconds for connect, read, and write in the current major version.
So the path that's most likely to hit a fresh socket under load (because subscribers are constructed on-demand, not pre-warmed in a pool) is also the path that gets the most aggressive timeouts. Add any small amount of network jitter, any small queue at ElastiCache's accept layer, any DNS resolution variation, and `Socket.tcp` inside `RubyConnection#connect` runs out the 1.0 second `connect_timeout` clock, raises `Errno::ETIMEDOUT`, and the rescue chain delivers a `Redis::CannotConnectError: Connection timed out: 1.0s` to the application. The error tracker adds another row.
The fix, for me, was extracting the timeout config to a shared constant and merging it into the subscriber construction:
```ruby
REDIS_TIMEOUTS = {
connect_timeout: 3,
read_timeout: 1,
write_timeout: 1,
}.freeze
# main pool
redis_configuration.merge!(REDIS_TIMEOUTS)
$redis = ConnectionPool::Wrapper.new(...) { Redis.new(**redis_configuration) }
# subscriber path
subscriber = Redis.new(
redis_pool.connection.slice(:host, :port, :db, :id).merge(REDIS_TIMEOUTS)
)
```
Four lines of actual change. The error count fell from thousands a day to just a couple the same day.

## Things I tried that didn't help
The honest part of any debugging write-up is the dead ends. I spent most of the month on these.
**Increasing the connection pool size.** The first instinct when you see connection errors is "there aren't enough connections." I went from 10 to 20 to 30. The error count didn't change. In retrospect, this makes perfect sense. The pool size only matters if pool exhaustion is the failure mode, and pool exhaustion would surface as `ConnectionPool::TimeoutError`, not `Redis::CannotConnectError`. I was debugging the wrong layer.
**Looking for KEDA cold-start correlation.** ElastiCache connection bursts during pod cold-starts are a real thing[^5], and the autoscaler here is KEDA. I pulled the scaling event timestamps and overlaid them on the error timestamps. There was *some* correlation, but not enough to be load-bearing. There were error spikes during steady-state windows where no scaling event happened, and clean windows during fairly aggressive scaling. The correlation was real but not causal in the way I was hoping for.
**Looking for cross-call patterns.** I thought maybe a specific endpoint or job class was disproportionately implicated. I tagged the errors by code path and aggregated. The distribution was broad. Almost every call site was affected proportional to its traffic share. This actually was a useful clue I missed: a "broad distribution" suggests the problem is in a layer below the call site, not in any particular consumer. I just didn't think of it that way at the time.
**Suspecting DNS.** ElastiCache endpoints are DNS names that resolve to internal IPs. If DNS resolution gets slow, your connect-phase latency goes up. The redis-client connect path passes the same value to `Socket.tcp`'s `resolv_timeout` and `connect_timeout` arguments, so a DNS phase that exceeds your connect timeout surfaces as a connect timeout in your application. I checked the VPC DNS resolver metrics, the per-ENI packet rate (1024/sec/ENI is the AWS limit[^6]), and the distribution of `getaddrinfo` calls. None of it pointed to DNS. Worthwhile check, dead end.
In hindsight, the thing all the dead ends had in common was the assumption that the connection-level config was already correct, and the search outward for what was different. The actual problem was that one specific construction path had different config from everything else, and the asymmetry was inside the application code.
## Things that should help but you can't tune on managed Redis
A lot of the canonical Redis-tuning advice on the internet revolves around Linux kernel parameters. Most of it doesn't apply when you're on a managed cache.
The `tcp-backlog` setting in Redis controls the size of the accept queue, the queue of completed TCP handshakes waiting to be picked up by the server[^7]. Redis's default is 511. The Linux kernel will silently truncate that to whatever `/proc/sys/net/core/somaxconn` is set to, which defaults to 128 on older kernels. Under a burst of new connections, this is the layer that drops connections silently before Redis ever sees them. The fix on a self-hosted Redis is to raise both `somaxconn` and `tcp_max_syn_backlog` on the host kernel.
On ElastiCache, you can't touch either. AWS doesn't expose host-level kernel parameters. Whatever they ship is what you get.
It's the same story for TCP keepalive intervals, connection timeout at the OS level, the ephemeral port range, the conntrack table size. These all matter for self-hosted setups and they're all behind the wall on a managed service. If a kernel-level setting is what's causing your connection errors, the only lever you have is "use a bigger instance type" and hope the larger one was provisioned more generously.
The instance type does matter for one thing: network bandwidth. ElastiCache nodes have a baseline bandwidth and a burst bandwidth, and if you exceed the baseline for too long the network gets throttled[^8]. The CloudWatch metric to watch is `NetworkBandwidthInAllowanceExceeded` (and the corresponding Out variant). If those are nonzero, network throttling is the layer that's biting you, and the fix is sizing up. I checked. Mine weren't.
Connection limits are another ElastiCache-side ceiling. Each node supports up to 65,000 concurrent client connections[^9], which is a lot, but the soft recommendation is to keep `currConnections` in the low hundreds for performance reasons. Aggressive connection churn (open, close, open, close) generates more CPU load than you'd expect. The current count wasn't anywhere near the hard limit, but it's worth knowing where the ceiling is.
## Verifying your client config actually plumbed through
The cheapest, fastest way to confirm a configuration change actually applies is to introspect the runtime client and read what the underlying object thinks the values are. For redis-rb wrapping redis-client, the relevant accessor is `_client.config`:
```ruby
$redis._client.config.connect_timeout # => 3.0
$redis._client.config.read_timeout # => 1.0
$redis._client.config.write_timeout # => 1.0
# and crucially, do the same for the subscriber path:
sub = Redis.new($redis.connection.slice(:host, :port, :db, :id).merge(REDIS_TIMEOUTS))
sub._client.config.connect_timeout # => 3.0 (was 1.0 before the fix)
```
This is a runtime check, not a config-file check. The thing that actually loaded into the client. If your config-file value and the runtime value disagree, you have a layering bug somewhere in your stack and you should chase it before doing anything else.
Most clients have an equivalent. In `redis-py` it's `client.connection_pool.connection_kwargs`. In `ioredis` it's `client.options`. In `Lettuce` it's `client.getOptions()`. The pattern works the same way: if you can't introspect what your client believes about its own configuration, you can't trust your dashboards about why it's failing.
## Why I picked connect_timeout=3s
A small note on the value itself.
The default 1.0 second was too aggressive for this setup. The connect timeouts that fired were succeeding immediately on retry, which is the textbook signature of "the timeout is shorter than the natural variance of the network." On ElastiCache, the natural variance includes DNS resolution time, AWS network jitter, and any small queue at the cache's accept layer. One second left zero margin for any of that.
The old 5.0 second default was too forgiving. If a connect actually fails for a real reason (instance went away, network partitioned, security group misconfigured), a 5-second timeout means your worker thread is wasted for five seconds. In a Rails request path with Puma threads, that's the difference between "one bad request" and "queue depth grows, p99 latency climbs, autoscaler triggers."
3.0 seconds is what I landed on. Long enough to absorb network jitter without faking a problem. Short enough that a real connect failure surfaces in time for the worker to retry or fail the request gracefully. This is a defensible middle ground, not a magic number. If your network is more stable or your latency budget is tighter, you'd pick differently.
## What this gets you, what it doesn't
The fix doesn't cure anything except the specific footgun where one code path was using gem defaults instead of the configured timeouts. If ElastiCache itself is overloaded, the 3-second timeout will still fire. If a node fails over, there will still be a burst of errors during the cutover. If the network actually breaks, it'll show.
What it does fix is the *baseline rate* of false-positive connect-timeout errors that were happening under perfectly normal conditions, simply because the path that needed the most generous timeout was getting the most aggressive one.
## See also
For the same shape of "the connection layer is fine, the client layer is what's wrong" in a different stack, the [PgBouncer rollouts post](/posts/pgbouncer-zero-downtime-rollouts/) walks through the equivalent Postgres-side trap (rolling pods drop in-flight client connections because the proxy can't tell them to reconnect first). For the broader pattern of pushing dynamic configuration into running Rails workers without a redeploy, the [config-edits post](/posts/configmap-dynamic-event-driven/) covers the propagation channel that would let you hot-reload `connect_timeout` without restarting the fleet.
## Closer
If you're debugging Redis connection errors and the dashboards are clean, the first place I'd look is whether every code path that constructs a Redis client is using the same timeout config. The gap between "what you set on your main pool" and "what some other code path silently inherits" is where this kind of bug lives. The error count looks the same regardless, but the load-bearing line of the failure is in your own code, not in your infrastructure.
If you've worked through something similar, or hit a different version of this same trap on another client library, I'd love to hear about it. [maria@runbookpages.com](mailto:maria@runbookpages.com). The closer the experience to "tried this, here's what bit me," the more useful.
*Related: distributed locks via Redis pub/sub, connection pool exhaustion, TCP socket lifecycle, layered gem defaults, managed-cache observability, redis-rb error taxonomy, ElastiCache operational ceilings.*
[^1]: redis-rb, [`lib/redis/errors.rb`](https://github.com/redis/redis-rb/blob/master/lib/redis/errors.rb). Defines `Redis::BaseConnectionError` and its subclasses: `CannotConnectError`, `ConnectionError`, `TimeoutError`, `InheritedError`, `ReadOnlyError`. The class docstrings draw the same distinction the body of this section does.
[^2]: redis-client, [`lib/redis_client/ruby_connection.rb`](https://github.com/redis-rb/redis-client/blob/master/lib/redis_client/ruby_connection.rb), `RubyConnection#connect`. The `Socket.tcp(host, port, connect_timeout: ..., resolv_timeout: ...)` call raises `Errno::ETIMEDOUT` on connect-timeout. The inner rescue mutates the message to append `: Xs`, the outer rescue translates `SystemCallError` to `RedisClient::CannotConnectError`.
[^3]: redis-rb, [*CHANGELOG for 5.0.0*](https://github.com/redis/redis-rb/blob/master/CHANGELOG.md). "Default client timeout decreased from 5 seconds to 1 second." The current default for `reconnect_attempts` is `1` (set in [`lib/redis.rb`](https://github.com/redis/redis-rb/blob/master/lib/redis.rb) inside `Redis#initialize`), and the [5.0 planning issue](https://github.com/redis/redis-rb/issues/1070) frames the post-5.0 defaults as part of a broader "fail fast, don't mask infrastructure issues" philosophy.
[^4]: Redis project, [*Pub/Sub specification*](https://redis.io/docs/latest/develop/interact/pubsub/). Subscriber connections enter a special mode in which they cannot run other commands, which is why every client recommends a dedicated socket.
[^5]: KEDA project, [*scalers documentation*](https://keda.sh/docs/). Default polling interval is 30 seconds. Tuning down to 10 seconds and pre-warming a baseline pool is the standard advice for connection-burst-sensitive workloads.
[^6]: AWS, [*VPC DNS quotas*](https://docs.aws.amazon.com/vpc/latest/userguide/vpc-dns.html). Each EC2 ENI is limited to 1024 packets per second to the Route 53 Resolver. Bursts past this rate produce silent DNS resolution failures that surface as connect errors in the application layer.
[^7]: Redis documentation, [*initial tuning*](https://redis.io/learn/operate/redis-at-scale/talking-to-redis/initial-tuning). Discusses the relationship between Redis's `tcp-backlog`, `somaxconn`, and `tcp_max_syn_backlog` and why the kernel silently truncates the configured backlog to the lower of the two.
[^8]: AWS, [*ElastiCache CloudWatch metrics*](https://docs.aws.amazon.com/AmazonElastiCache/latest/dg/CacheMetrics.WhichShouldIMonitor.html). Baseline and burst bandwidth vary by instance type. The relevant CloudWatch metrics are `NetworkBandwidthInAllowanceExceeded` and `NetworkBandwidthOutAllowanceExceeded`.
[^9]: AWS, [*ElastiCache best practices: large number of connections*](https://docs.aws.amazon.com/AmazonElastiCache/latest/dg/BestPractices.Clients.Redis.Connections.html). Each node supports up to 65,000 concurrent client connections, with the soft recommendation to keep current connections in the low hundreds for performance.
---
# Post: Dynamic per-user Rails debug logs, scoped to the request
URL: https://runbookpages.com/posts/per-user-debug-logging-rails
Published: 2026-05-04
Tags: rails, logging, semantic_logger, redis, platform
> Turning on debug logs for one specific user's next handful of requests. Thread-local silence, request-scoped tags, and how it cooperates with the per-component dial from the previous post.

A user has been failing the same flow three times in a row. Their account looks fine. The inputs are well-formed. The trace says we got to the service that should have completed the transaction, then we did, then somehow the user is back at the failure screen. It's the same playbook as always: you want debug logs from their next attempt.
You can crank `Rails.logger.level = :debug` for the whole fleet. You will not, because you saw the logs bill last quarter. (If the volume math behind that is unfamiliar, the previous post has [a primer on why production defaults sit at `info` or `warn`](/posts/per-component-log-levels-rails/#a-quick-primer-on-log-levels-since-defaults-vary).) You can dial `PaymentsService` to debug with the per-component pattern from [that post](/posts/per-component-log-levels-rails/). That works, but now you're logging every user's payments at debug, and most of them aren't the user you care about. The signal is still buried, just under a smaller pile.
You're after a different shape entirely. Debug for THIS user's next handful of requests. Everyone else stays at whatever the app's default is. Filterable in the aggregator by user. Expires on its own. Cooperates with the per-component dial without stomping on it.
This post is how I got there.
## What I wanted
Concrete requirements:
Per-user, not per-class. Last post's dial handled per-class. The new one works on the orthogonal axis.
Request-scoped. When user 12345's next request comes in, that request's lines emit at debug. When their request completes, the dial unwinds. The next request on the same worker thread starts clean.
A wall-clock TTL on top of that. If I turn on debug for a user at midnight chasing a bug, I shouldn't wake up to nine hours of debug spew across whatever traffic they generated overnight. A finite TTL on the dial entry handles cleanup so I don't have to remember.
Filterable in the aggregator. I want a query like `user_debug=12345` (or whatever syntax your stack uses) to surface exactly the lines from that user's debug session, none of the other users, none of the other request types.
Cooperative with last post's per-component dial. If `MailerService` is already dialed up via the class-level pattern, my per-user override should still be able to push it further for the one user. The two layers should compose, not collide.
## Approaches I considered
**`Rails.logger.level = :debug` for the fleet.** It's the same sledgehammer I covered last post.
**The per-component dial from last post.** Closer. Dial `PaymentsService` to debug, get debug for that one class. But you also get debug for every user's calls into `PaymentsService`, which is the wrong shape when the bug is one user.
**`ActiveSupport::TaggedLogging`.** The default Rails answer for "scope a logger to a request." But it adds tags only, it doesn't change which lines emit[^1]. Wrapping a request in `Rails.logger.tagged("user-12345") do ... end` gives me a tag on every line that already would have emitted at the current global level. The debug lines I actually wanted still don't fire, because the level is still wherever the app's default sits.
**Prefab's filter approach.** Same as the previous post: solves it, SaaS dependency, plus the appender-filter shape composes oddly with the class-level dial. Both layers see every line independently and have to agree.
**A custom logger subclass with a thread-variable level.** Wrap `Rails.logger` in a subclass that consults a thread variable for the current minimum level. It's doable in maybe twenty lines of code. But it duplicates work that semantic_logger already does and adds a custom logger that future readers have to mentally model. I had a working semantic_logger pipeline. I didn't want to fork it for one feature.
**`SemanticLogger.silence` in an around_action.** Once the per-component dial from last post was clean, this turned out to be the right answer. `silence(level)` is a block-scoped function on a thread-local minimum level[^2]. It lowers the threshold for the duration of the block. The block is ensure-scoped, so nothing leaks if it raises. There's no per-line overhead either. And it cooperates cleanly with the per-component dial as long as you built the dial right. (See [post 1's trap section](/posts/per-component-log-levels-rails/#the-trap-that-took-the-longest-to-see).)
What ruled all of these in or out: the dial had to be per-user and request-scoped, had to filter cleanly in the aggregator, and had to coexist with the existing per-component pattern. `silence` plus `tagged` met all four.
![A dark stage scene. Nine small abstract user figures stand in a row, each labeled with a user id. A spotlight from above casts a focused cone of warm light onto user 12345 in the center, illuminating them in cream and orange while the other eight users stay in shadow. A log-output panel above the stage shows three orange [DEBUG] lines tagged `user_debug=12345`: CartController starting checkout attempt #4, InventoryService confirming the item is in stock, PromoService declining with PROMO_EXPIRED. Caption beneath: `one user lit, the rest in shadow. only their request, scoped to its lifecycle.`](/images/per-user-log-levels-meme.svg)
## What I built
A small module:
```ruby
module RequestScope
def self.apply(user_id, &)
return yield if user_id.blank?
override = Cache.level_for(user_id)
return yield if override.nil?
SemanticLogger.silence(override) do
SemanticLogger.tagged(user_debug: user_id, &)
end
end
end
```
Wired at the application controller as an around_action:
```ruby
class ApplicationController < ActionController::Base
prepend ComponentLogger # from the previous post
around_action :apply_user_debug_logging
def apply_user_debug_logging(&)
RequestScope.apply(current_user&.id, &)
end
end
```
Three lines of glue plus the module. All of the surface area lives here.
Inside `apply`:
`Cache.level_for(user_id)` checks an in-process map for an override. If nothing's set, the block runs unwrapped and the cost is one map lookup. No-op for ~99% of requests.
If an override exists, we wrap the block in two ensure-scoped layers.
`SemanticLogger.silence(override)` sets a thread-local minimum level for the duration of the block. While the block is running, any logger whose own `@level` is unset falls back to a check against this thread-local, and lines at the silenced level (or higher) emit. Lines below the silenced level still get short-circuited.
`SemanticLogger.tagged(user_debug: user_id, &)` attaches a named tag to every log entry inside. Both `silence` and `tagged` are ensure-scoped inside semantic_logger, so the thread-local state restores even if the block raises. There's no risk of a per-user dial leaking onto the next request that lands on the same worker thread.
In the aggregator, this shows up as a structured tag on every line emitted during that user's request. Whatever query language your aggregator speaks, you can pin a query to just that user's session and exclude everything else: other users' requests, health checks, unrelated background traffic.
The whole shape, drawn end-to-end:
```mermaid
flowchart TD
A[request from user 12345] --> B[around_action: apply_user_debug_logging]
B --> C[Cache.level_for user_id]
C --> D{override
in cache?}
D -->|no| E[yield without wrapping]
D -->|yes| F["SemanticLogger.silence(level)"]
F --> G["SemanticLogger.tagged(user_debug: 12345)"]
G --> H[block runs through
controller, services, jobs]
H --> I[each log line emits at silenced level
and carries the user_debug tag]
I --> J[unwind: silence and tag cleared]
E --> K[response]
J --> K
```
## The store and the cache
`Cache.level_for(user_id)` reads from a process-local concurrent map. The map gets refreshed when the per-user store changes, which keeps the per-request lookup at memory speed.
The store under the cache is a single Redis hash, keyed `user_debug_logging`, with each field keyed by user_id and the value encoding the override. I went with a hash rather than separate keys per user (`user_debug:12345`, `user_debug:67890`, and so on) for two reasons. The first is enumeration: pulling every active override is one `HGETALL` instead of a `SCAN` across the keyspace, which matters when an operator wants to list everyone currently flagged or clear them in a hurry. The second is locality: every override sits under the same key, so dumping the full state, counting active overrides, or wiping the whole thing is a one-line operation. The separate-key shape scatters the overrides across the keyspace and forces a SCAN every time.
The catch with hashes is that Redis doesn't expose per-field TTL. With separate keys I could call `SETEX user_debug:12345 1800 :debug` and Redis would evict the entry after thirty minutes on its own. Hashes only have TTL on the whole hash, not on individual fields. So expiry gets enforced in code: each value encodes `level:expires_at`, and on read the code compares `expires_at` to the wall clock. If the timestamp is in the past, the entry is treated as missing and lazily deleted from the hash. On the broadcast-driven refresh, the cache loader also sweeps any expired fields it finds while it's already iterating, which keeps the hash bounded long-term. The pattern is `lazy + sweep` rather than `set TTL and forget`, but the operational result is the same: dead entries don't pile up.
The cross-pod invalidation question, how does pod B find out that pod A wrote a new override, gets handled by a broadcast layer on top of the same store. That's a separate post about the broadcast pattern itself. For this post, "the cache is fresh within a second of any write" is enough.
## The cooperation with the per-component dial
`SemanticLogger.silence` only takes effect when the per-class logger's `@level` is unset. The per-component dial from the previous post has a deliberate `@level = nil` branch: when the config store says "default level for this class," it clears `@level` rather than leaving it pinned at whatever the last write was. That cleared state is what lets the thread-local silence kick in for that class.
Without that branch in post 1, the per-user override would silently fail for any class that had ever called `logger` after boot. The class would have `@level` pinned to whatever the app's default is (`info`, `warn`, depending on your config), the silence would be ignored, and the debug lines wouldn't emit for that class even with the user-level dial set. The investigation would seem fine. The override would be in the store. The around_action would be firing. The tag would be on the lines that did emit. But the lines you cared about wouldn't be there.
The two features cooperate because the per-component dial deliberately leaves room for the per-user one to take over. Building post 1 without thinking about post 2 would have made post 2 silently broken. The fix in post 1 takes one line and one comment, but it carries the weight of this whole pattern.
## What this gets you
A working dial for "log everything for this one user, for the next 30 minutes." Write the override into the config store from a Rails console, an internal admin endpoint, or whatever surface you want to expose: `user_id: 12345, level: :debug, expires_at: 30.minutes.from_now`. The next request from that user hits the around_action, picks up the override, and emits debug logs for the whole request lifecycle. The aggregator receives every line tagged with a `user_debug` field set to that user's id. Filter on the tag, see only that user's session.
After 30 minutes the entry expires. The next read returns nil. The around_action becomes a no-op for that user. There's no cleanup to do, no follow-up to remember.
The cooperation with the per-component dial means I can also turn on debug for a class and a user at the same time, and they layer cleanly. Class is dialed up one notch via the per-component pattern, user gets `silence(:debug)` for their request, and that user's lines come out at debug while everyone else's lines come out at the class's dialed level. The two-axis grid works.
## What it doesn't
Async jobs need a small wiring step. Thread-locals don't auto-propagate across the ActiveJob boundary, so a job enqueued during user 12345's request runs on a different thread (often on a different process) where `silence` is unset. Good news: this comes up often enough that the patterns are well-worn. Three standard fixes:
1. **Pass the user id explicitly as a job arg.** The most common approach. The job has `user_id` in its arguments and calls `RequestScope.apply(user_id, &)` itself, mirroring the controller's around_action shape. Bake the call into `ApplicationJob#perform` with a `prepend`'d concern and every subclass inherits.
2. **Use `ActiveSupport::CurrentAttributes`.** Rails ships this for ambient request-scoped state, and the built-in ActiveJob serializer auto-propagates registered attributes across `perform_later`[^3]. Stash the override id on a `Current.user_id` attribute and the job sees it for free, no per-job wiring.
3. **Custom job-backend middleware.** Sidekiq, GoodJob, and SolidQueue all have client/server middleware hooks for capturing context on enqueue and restoring it on perform. Sidekiq's own [tagged-logging context](https://github.com/sidekiq/sidekiq/wiki/Logging) is solid prior art for this shape.
I went with (1) because the jobs in our app already pass `user_id` for unrelated reasons. (2) is probably cleaner if you're starting fresh, since the auto-propagation removes a class of "I forgot to thread the override into this job" bugs.
Non-controller paths need their own wiring. The hook lives in a controller around_action, so anywhere the request boundary isn't a controller (cron triggers, message-broker callbacks, internal pollers, signal handlers), the around_action doesn't run. The fix has the same shape: call `RequestScope.apply` at the entry point of whatever the path is. Each entry point has to be wired explicitly. The pattern doesn't propagate by itself.
Class-level dials still win when both are set. If a class has been pinned to a non-default level via the per-component dial, and I want this user at a finer level than that pin, the per-user override loses for that class. The class's `@level` is pinned, so `silence` doesn't apply. In practice this comes up rarely because class-level dials are usually transient and short-lived, but it is the shape worth knowing about. The two layers compose for "user-level debug while class is at the app default" but not for "user-level debug while class has its own non-default pin."
The aggregator still has to support tag filtering for this to be useful at all. If you're on a logging stack that doesn't index custom tags, the `user_debug` filter does nothing for you. Most modern aggregators index custom tags by default. Some hosted budget-tier loggers don't. It's worth checking before you wire this up.
## Closer
If you've built per-user logging in Rails before, especially in a multi-tenant or per-customer setup, I'd love to compare notes. The async-job propagation problem in particular has a few ways to solve it (concern on ApplicationJob, explicit pass-through in perform args, ActiveSupport::CurrentAttributes) and I'm curious which one held up for you. Email's on the contact page. The closer to "I tried this and here's the constraint that bit me," the better.
The pattern from this post sits on top of the per-component dial from [the previous one](/posts/per-component-log-levels-rails/). The two together cover most of the "turn on debug logging for X" cases that come up in production: X is a class, X is a user, and (with both at once) X is a class for one user.
[^1]: Rails API, [*ActiveSupport::TaggedLogging*](https://api.rubyonrails.org/classes/ActiveSupport/TaggedLogging.html). Wraps a block to attach a tag to every log entry inside. The level itself is not changed.
[^2]: Reid Morrison, [*Semantic Logger* docs](https://logger.rocketjob.io/). `SemanticLogger.silence` reduces the minimum level for the duration of a block on the calling thread. Ensure-scoped, so the thread-local state restores even if the block raises. Per the docs, the suppression only applies to loggers that are using the global default level. If a logger has an explicit `@level` pinned, `silence` is ignored for that logger. This is the property the per-component pattern from the previous post leaves intact on purpose.
[^3]: Rails API, [*ActiveSupport::CurrentAttributes*](https://api.rubyonrails.org/classes/ActiveSupport/CurrentAttributes.html). Thread-isolated, request-scoped attributes that auto-reset between requests. ActiveJob has built-in support for serializing registered Current attributes across `perform_later`, so ambient context follows the job to the worker without per-job wiring.
[^4]: Rails issue [#20490](https://github.com/rails/rails/issues/20490), *Rails.logger log level is not thread safe*. The historical thread on why naive `Rails.logger.level = :debug` from inside a request is unsafe. Modern Rails fixes this with `IsolatedExecutionState`, but the issue is the canonical context for why thread-local level mutation needs care.
---
# Post: Tuning Rails log levels per class, without a redeploy
URL: https://runbookpages.com/posts/per-component-log-levels-rails
Published: 2026-05-03
Tags: rails, logging, semantic_logger, platform
> A small concern that gives every base class its own logger with a runtime-tunable level, so you can crank debug on one service for thirty minutes without touching the rest of the app.

Friday afternoon. A subset of users in one country aren't getting their transactional emails. The trace says "delivered" through the service that hands the message off, then nothing useful. The mailer is logging at whatever your app's production default is, same as the rest of the codebase. The next step is obvious. Turn on debug for the mailer, see what it's doing, find the bug.
Most engineers reach for `Rails.logger.level = :debug` first. That's the whole-app logger, though. Crank it on a fleet of forty pods serving live traffic and you're paying log volume for every controller, every job, every render, for one investigation that needs maybe twenty lines from one class. Every aggregator-indexed line is a few million lines of noise around the signal. The bill goes vertical. Half your team's queries time out because the logs explorer is choking. This is the sledgehammer-for-surgery problem[^1] and it's been the state of Rails logging for as long as I've been writing it.
I wanted a dial that was per-component, runtime-tunable, and didn't need a redeploy. Crank the mailer to debug for thirty minutes, leave the rest at the production default, have it expire on its own when I forget about it.
This post is how I built it.
## A quick primer on log levels, since defaults vary
Ruby's standard log levels go `debug`, `info`, `warn`, `error`, `fatal`, in increasing order of severity. The logger holds a level threshold. Lines emitted below the threshold are short-circuited and never reach the appender. So a logger at `info` will emit `info`, `warn`, `error`, `fatal` lines and silently drop `debug` ones.
Rails defaults to `info` in production[^6]. Plenty of teams move it to `warn` for high-volume apps because `debug` is the firehose: ActiveRecord query traces, cache hits, every internal callback a library author thought to log, every cookie session lookup. On a busy fleet, dropping the global threshold to `debug` can multiply log line volume severalfold to an order of magnitude depending on the app's shape, and your aggregator is going to bill you for every byte. Most teams pick `info` or `warn` to keep that bill sane and rely on tracing tools for the high-frequency stuff.
That tradeoff defines the entire shape of this problem. The moment you actually need `debug` for an investigation, you're asking the fleet to pay debug-level volume for everyone else's traffic too. Whatever your default is, the dial in this post breaks that constraint: you crank one class to debug, the rest stay at the default, and the volume bill barely moves.
## What I wanted
A few requirements ruled options in or out.
Per-class control was the first need. Setting the level on the controller layer alone won't cut it. Most of the interesting work happens downstream of the controller, in jobs, mailers, service objects, view components, and whatever else your app has accumulated into base classes. Anywhere I have a class with a meaningful boundary, I want to be able to dial its logger independently.
It also had to change at runtime, with no redeploy involved. An investigation dial only earns its name if it's available the moment you need it, not after a CI cycle.
And it had to expire on its own. If I crank a service to debug at midnight chasing a bug, I shouldn't wake up to a nine-hour debug spew because I forgot to turn it off. A finite TTL handles the cleanup so I don't have to remember.
## Approaches I considered
**Cranking `Rails.logger.level` globally.** This is the default reflex, and it works fine for development. In a production fleet of forty pods serving live traffic, it's the sledgehammer-for-surgery problem from above. Even with five-minute investigations, the aggregator cost is real, and you're polluting every other engineer's logs while you're at it. I ruled this one out fast.
**Lograge.** [Lograge](https://github.com/roidrage/lograge) reformats Rails request logs into one-line entries and is excellent for what it does. But it's a request-line cleanup, not a level controller. The level still lives on `Rails.logger`. Doesn't solve this problem.
**Tagged logging.** `ActiveSupport::TaggedLogging`[^2] lets you wrap a block in `tagged("user-123") do ... end` and every log entry inside picks up the tag. But again, it's tags, not levels. Wrapping `MailerService.deliver` in a tagged block doesn't change which lines emit, it changes how they're labeled. It solves the filtering problem after the fact, not the volume problem.
**Prefab's filter approach.** [Prefab.cloud](https://prefab.cloud/blog/ruby-dynamic-logging-with-a-semantic-logger-filter/) ships a Semantic Logger filter you wire as `SemanticLogger.add_appender(filter: Prefab.log_filter)`[^3]. Per-line, the filter Proc evaluates whether to emit, and can read dynamic config from Prefab's SaaS. This is a clean shape and probably the closest thing to industry-standard for this problem. The downside for me was the SaaS dependency. The dial config sits in their service. An outage there is an outage of my debugging primitive at exactly the worst time. I wanted the dial in my own infrastructure.
**Plain `SemanticLogger[ClassName]`.** [Semantic Logger](https://logger.rocketjob.io/)[^4] gives every class its own logger via `SemanticLogger[MailerService]`. That part is excellent. Each class's lines come out with the class name in the named-class slot, indexable in the aggregator with no extra work. The level on each per-class logger is a class instance variable, though, which means it's static unless something mutates it. There's no "tune at runtime" baked in. So this gives me the per-class shape but I still need to build the dial.
What ruled all of these in or out: the dial had to live in my own config store, expire on its own, and not require a redeploy or an external service.

## What I built
A small concern, `prepend`'d into every base class that owns a meaningful boundary in the app. `ApplicationController`, `ApplicationJob`, `ApplicationMailer`, `ApplicationRecord`, `ApplicationService`, `ApplicationCable::Channel`, `ApplicationComponent` (if you use ViewComponent), and any other base class your codebase has grown for things like message delivery or event broadcast. Each subclass inherits the behavior automatically.
The concern overrides one thing: the class-level `logger` method.
```ruby
module ComponentLogger
extend ActiveSupport::Concern
included do
helper_method :logger if respond_to?(:helper_method)
include SemanticLogger::Loggable
end
delegate :logger, to: :class
class_methods do
def logger
@semantic_logger ||= SemanticLogger[name]
current_level = logger_level
if current_level == SemanticLogger.default_level
@semantic_logger.level = nil
elsif @semantic_logger.level != current_level
@semantic_logger.level = current_level
end
@semantic_logger
end
def logger_level
if @_cached_level && @_cached_level[:expires_at] > Time.current
return @_cached_level[:level]
end
level = config_store.get(logger_key)&.to_sym || SemanticLogger.default_level
@_cached_level = { level:, expires_at: Time.current + log_level_cache_ttl }
level
end
def logger_level=(level)
level = level.to_sym
config_store.setex(logger_key, log_level_expiry, level)
@_cached_level = { level:, expires_at: Time.current + log_level_cache_ttl }
@semantic_logger.level = level if @semantic_logger && @semantic_logger.level != level
end
def logger_key = "log_levels:#{name}"
def log_level_cache_ttl = 2.minutes
def log_level_expiry = 9.hours.to_i
end
end
```
Walking through it: every call to `MailerService.logger` checks the in-process cache. If it's been more than two minutes since the last refresh, the cache reads the config store. If the store has an explicit level for this class, the logger pins that level. If not, it clears the level. (More on why "clear" not "leave alone" in a moment.)
Setting the dial, via `MailerService.logger_level = :debug`, writes to the config store with a nine-hour TTL. After nine hours the entry is gone, the next read falls back to the default, and no one needs to remember to turn it off.
Use any key-value store with TTL support: `setex`, `get`, and process-local caching are the only operations the pattern needs. The cross-pod invalidation question, how does pod B find out that pod A changed the level, gets answered in a separate post about the broadcast layer underneath. For the purposes of this pattern, two-minute eventual consistency is fine, and the broadcast layer brings it under a second when it matters.
## The `include` that did nothing
The `prepend` in the snippet above is doing real work. I tried `include LoggerConcern` first, the way you reach for any concern by default. It silently did nothing on the Rails base classes I cared about. The dial was set, the cache was warm, the class-level method ran when I called it directly in a console, and yet every `controller.logger` inside the app kept resolving to the inherited `Rails.logger`, ignoring the per-class dial entirely.
Method-lookup order is what trips this up. Rails base classes wire `logger` via `class_attribute :logger`, which defines both a class-level reader and an instance-level reader directly on the base class itself (`AbstractController::Base`, `ActiveJob::Base`, `ActionMailer::Base`, all of them). With `include`, the concern's instance method (the `delegate :logger, to: :class`) ends up shadowed in real call paths by the inherited base-class `logger`. With `prepend`, the concern's instance methods sit above the including class itself in the ancestor chain, which means the delegate always fires first and lands on the class-level method I actually wrote.
Just one keyword changed. It's worth flagging because the failure was silent: the dial *appeared* to work, the tests *could* pass if they were calling the class-level method directly, but the instance-level call paths that emit actual log lines were never going through the dial. The bug didn't fail loud.
## The cooperation, drawn
Before the trap section dives into the mechanism, a picture of the two states the dial can be in. The branch that pins `@level` versus the branch that clears it back to nil is the load-bearing piece, and the consequence for whatever thread-local override is layered on top is the whole story.
```mermaid
flowchart TD
A[ComponentLogger.logger called] --> B[read level from config store]
B --> C{store override differs
from global default?}
C -->|"no, or unset"| D["@semantic_logger.level = nil"]
C -->|"yes, non-default pin"| E["@semantic_logger.level = override"]
D --> F[logger falls back to
SemanticLogger.default_level_index]
F --> G[thread-local silence respected
per-user override can win]
E --> H[per-class level pinned
thread-local silence ignored
per-user override loses for this class]
```
## The trap that took the longest to see
Look at the level-pinning block again.
```ruby
if current_level == SemanticLogger.default_level
@semantic_logger.level = nil
elsif @semantic_logger.level != current_level
@semantic_logger.level = current_level
end
```
Pay attention to the `@semantic_logger.level = nil` branch. That's where the weight lives. Without it, here's what breaks.
`@semantic_logger` is a class-level instance, one per class, shared across all the process's threads. When the config store has a class-level dial set, `@semantic_logger.level = current_level` is correct. When no dial is set, the obvious thing is to do nothing and leave the level wherever it was. That is wrong.
Why: `SemanticLogger.silence(level)`[^5] is the gem's thread-local, block-scoped helper for lowering the minimum log level inside a block. It's the standard way to say "drop this thread's level for the duration of this block, then restore it." Per the docs, `silence` only takes effect when the per-class logger's `@level` is unset, meaning the logger falls back to `SemanticLogger.default_level_index`, which respects the thread-local. If the per-class logger has any explicit `@level` pinned, `silence` is ignored for that logger.
That property is load-bearing for a sibling feature I'm covering in the next post: per-user per-request log overrides built on `silence`. If the per-class dial here pins `@level` whenever it runs, the sibling feature is silently dead, because every class would be ignoring the thread-local override.
So if the method body sets `@semantic_logger.level` once, to anything, and never clears it, the thread-local override is permanently dead for that class. The first call to `MailerService.logger` after boot pins `@level` to whatever the app's global default is (`info`, `warn`, whatever). Every subsequent thread-local override fails silently for that class.
Fixing it takes the explicit `nil` branch. Whenever the config store says "default level for this class," clear `@level` back to nil and let the logger fall back. The class-level dial only pins `@level` when a non-default override is actually set. When it isn't, the thread-local is free to take over.
This is a one-line change with a five-line comment, and the comment is the longer of the two on purpose. Anyone removing the `nil` branch later would assume it was a no-op.
## What this gets you
A working dial. Call `MailerService.logger_level = :debug` from a Rails console, an internal admin endpoint, a feature-flag platform, or however you choose to expose the setter to operators. The next request that touches that class emits debug logs, indexed in the aggregator under `MailerService`. The other thirty-something component classes stay at the app's default. Aggregator volume goes up by maybe a tenth of a percent.
After thirty minutes, or nine hours if you forget, the entry expires and the logger falls back. There's no cleanup to do, no follow-up to remember.
The pattern scales to anything with a base class. I have the concern `prepend`'d in eight or so places, ApplicationController and ApplicationJob and the rest, and every subclass under each base inherits the dynamic logger automatically. Adding a new component is one line.
It also keeps the aggregator clean. Every emitted log carries the class name as a structured field (Semantic Logger's named-class slot), so filtering by class Just Works in whatever query syntax your stack uses. The field is already there. You don't have to add any tagging code on the app side.
## What it doesn't
The two-minute cache means a level change has up to two minutes of skew across the fleet by default. The broadcast layer brings it under a second, but that's a separate piece.
It doesn't change how individual lines emit, only whether they emit. If you want to filter individual lines by content, suppress every `health_check`, log every line for one user, that is the appender-filter approach Prefab uses. Both shapes are valid. This one is cheaper at the high-volume end because below-level lines short-circuit before reaching the appender. The filter approach is more flexible because the Proc has full context of every log line.
It doesn't help with libraries that own their own loggers. `Sidekiq.logger`, gem-internal logging, anything that resolves a logger by some other path goes through whatever level it was configured with. The pattern is "every component I own."
The pattern most surprised me by working everywhere. The interface is the same anywhere a base class exists: `prepend ComponentLogger` and you're done. The dial is now available for that class.
## What I'd revisit today
I shipped this with a TTL cache. At read time, every pod checks its own in-memory map. Every pod independently decides when to refresh. Writes wait out the cache window before showing up everywhere. That worked, and the production fleet has been running on it for over a year. But the more system design I've done since then, the more I'd push back on the TTL-cache shape if I were proposing it in a design review today.
The structural issue is read-side polling. Every pod has its own clock for invalidation. Most of the time the staleness doesn't matter, but during an active investigation, when you're flipping the dial back and forth checking a hypothesis, the two-minute lag is visible and frustrating. A senior reviewer asking "what happens when pod A and pod B see different values for the same level" is asking the right question, and "they reconcile within two minutes" is the wrong answer for an investigation primitive.
Three cleaner store shapes for the same problem:
1. **Pub/sub invalidation.** Writes go to the store and publish an invalidation message at the same time. Every pod subscribes, drops its cache on each invalidation, refreshes on the next read. Convergence goes from minutes to seconds. Redis pub/sub is the simplest version, NATS or Kafka if you want durability.
2. **Watch-based config.** Treat the level as declarative state in something like etcd, Consul, or a Kubernetes ConfigMap, and use the store's native `WATCH` primitive to push changes. Each pod sees the new value as soon as it lands, no polling. I [wrote about exactly this pattern](/posts/configmap-dynamic-event-driven) with Kubernetes ConfigMaps as the store, and the shape can be simplified further if you swap the K8s watch for a broadcast layer like Redis Streams or a plain pub/sub channel.
3. **Versioned snapshots.** Bump a single version key on write. Pods cache by version, so a stale read pays one extra round-trip to verify the version, but it never returns out-of-date data.
The next post in this series goes with option (1) while extending this dial into per-user, per-request log overrides. Same per-class plumbing as here, but the store sits behind a pub/sub broadcast layer that pushes invalidations the moment a write lands. Convergence drops to under a second across the fleet. If you're building this from scratch and you have the option, skip the TTL-cache phase entirely and start with (1). The TTL phase mostly exists in this post because that's the order I built things in.
## Closer
If you've built something similar, or hit a failure mode I didn't, especially around the cooperation with thread-local overrides, I'd love to compare notes. Email's on the contact page. The closer to "I tried this and here's what bit us," the more useful.
Up next: the per-user flavor of this pattern. How to dial debug logging for one specific user through their next handful of requests, without redeploying, without affecting any other users, and without stomping on the per-component dial described here.
[^1]: Prefab Cloud, [*Changing Log Levels At Runtime in Rails*](https://prefab.cloud/blog/dynamic-log-levels/). The "sledgehammer for surgery" framing for `Rails.logger.level = :debug` lives in this post.
[^2]: Rails API, [*ActiveSupport::TaggedLogging*](https://api.rubyonrails.org/classes/ActiveSupport/TaggedLogging.html). Wraps a block to attach a tag to every log entry inside. The level itself is not changed.
[^3]: Prefab Cloud, [*Dynamic Ruby Log Levels With Semantic Logger & Prefab*](https://prefab.cloud/blog/ruby-dynamic-logging-with-a-semantic-logger-filter/). Covers the appender-filter shape as of prefab-cloud-ruby 1.6.0.
[^4]: Reid Morrison, [*Semantic Logger* docs](https://logger.rocketjob.io/). Per-class logger via `SemanticLogger[YourClass]`, the building block this pattern wraps.
[^5]: Reid Morrison, [*Semantic Logger*](https://logger.rocketjob.io/). `SemanticLogger.silence` reduces the minimum level for the duration of a block on the calling thread. Per the docs, suppression only applies to loggers using the global default level. If a logger has an explicitly configured `@level`, `silence` is ignored for that logger. This is the property the `nil` branch above leaves intact on purpose.
[^6]: Rails Guides, [*Debugging Rails Applications · Log Levels*](https://guides.rubyonrails.org/debugging_rails_applications.html#log-levels). Production defaults to `:info`. Levels go `:debug`, `:info`, `:warn`, `:error`, `:fatal`, `:unknown`, in increasing severity, and `debug`-level emissions in production "can have a massive impact on performance" because of how often Rails internals log at debug.
---
# Post: Rolling PgBouncer without dropped queries
URL: https://runbookpages.com/posts/pgbouncer-zero-downtime-rollouts
Published: 2026-05-02
Tags: pgbouncer, postgresql, rails, active record, kubernetes, platform
> On taking the connection-bad spike during PgBouncer rollouts to zero. Pooling modes, the three connection layers a rollout has to cross, the SIGTERM-vs-SIGINT dilemma, and where the actual fix lives.

Somebody on the SRE channel pings: "PgBouncer rolling again?" The application graphs catch up half a minute later, with a clean little spike of 5xx and a clean little spike of `PG::ConnectionBad`. The numbers come down. The deploy completes. Nobody investigates because everybody knows what happened: PgBouncer rolled, some open connections got severed, the application was on the wrong end of it. The next deploy will look the same.
This post is about what it takes to make that spike go to zero. Not "smaller." Zero. The interesting part is that almost the whole answer lives in the client, not in PgBouncer.
## What PgBouncer is, and why anyone runs one
Postgres backends aren't cheap. Each backend forks a process, allocates a megabyte or two of memory after warmup (more under load), and adds work on the server. A single Postgres instance handles a few hundred concurrent backends comfortably. A few thousand application worker processes (the typical shape of a Rails monolith on Kubernetes) can't each hold an open backend.
The standard answer is a connection pool. Rails ships with one inside ActiveRecord, scoped per process. That handles the per-process side, but it doesn't help you across processes: if every worker holds ten connections, a hundred-pod fleet holds a thousand connections, and you've blown past Postgres's `max_connections` before the first request of a busy hour.
PgBouncer sits between the application processes and Postgres and multiplexes. Application processes connect to PgBouncer with their usual Rails pool. PgBouncer holds a much smaller pool of real Postgres backends and hands them out per transaction (or per session, depending on configuration). The application never knows the difference. Postgres never sees more than the configured backend count.
A few alternatives exist. AWS RDS Proxy is the managed equivalent, useful if you don't want to operate a proxy yourself, with the trade-off of cost-per-vCPU billing, no prepared statement support, and an extra network hop. PgCat is a Rust rewrite with first-class sharding and better multithreading, less mature but worth tracking. Some teams skip pooling entirely by tuning Postgres backend memory down and provisioning a much larger instance. None of these change the shape of the problem this post is about. PgBouncer is what most production Rails-on-Kubernetes setups end up with.
## The pooling modes you can pick from
PgBouncer offers three [pooling modes](https://www.pgbouncer.org/config.html#pool-mode)[^1], each with a different contract with the application.
**Session pooling** is the most permissive. PgBouncer assigns a backend to a client session and keeps it for the entire lifetime of the client connection. Same as if PgBouncer wasn't there, just with the bookkeeping handled. You get full SQL semantics, including session-scoped state like temp tables, session GUCs, and advisory locks. The cost is zero pooling benefit if your clients hold connections for a long time. Effectively a bouncer that never sends anyone home.
**Transaction pooling** is the mode most Rails teams settle on. PgBouncer assigns a backend at the start of a transaction and releases it when the transaction commits or rolls back. A single application process can multiplex many transactions over a much smaller PgBouncer pool. Session-scoped state breaks here. Anything Postgres tracks across statements outside a transaction can fail or behave surprisingly, including prepared statements (without specific PgBouncer config), session GUCs, and advisory locks. Most Rails apps don't rely on session state on the hot path, so this mode covers the vast majority of traffic.
**Statement pooling** is the most aggressive. A backend is assigned per statement and released immediately. Multi-statement transactions don't work at all in this mode, so it's rarely useful for Rails.
The real choice is session vs transaction pooling, and the answer is almost always transaction pooling unless you have a workload that genuinely needs session state. The trade-offs you sign up for, like advisory locks being unsafe and prepared statement caching needing care, are well documented and avoidable in application code.
## Three layers, not one
If you want to think about rollouts cleanly, you have to think about three connection layers, not one.
The first layer is the **ActiveRecord pool**, scoped to the application worker process. A Ruby object holding a list of connection wrappers, with a checkout/check-in dance for thread-safety. Each entry in this pool corresponds to a real TCP connection.
The second layer is the **TCP socket** itself. From the kernel's point of view this is just an open file descriptor talking to a remote endpoint. The kernel doesn't know it's a Postgres connection. It doesn't even know the endpoint is PgBouncer rather than Postgres. It only knows there's a socket, and that the socket either has bytes to read, or doesn't, or has been closed by the remote side.
The third layer is the **backend connection from PgBouncer to Postgres**, which PgBouncer manages independently. PgBouncer holds its own pool of these. The mapping between "client connection from a Rails worker" and "backend connection to Postgres" is dynamic. In transaction pooling mode, a single Rails connection might use ten different Postgres backends over its lifetime.
The reason the three-layer view matters is that a PgBouncer rollout breaks layer two from PgBouncer's side. The Rails worker still believes its layer-one entry is healthy. The kernel might or might not have noticed the close yet, depending on TCP timeout settings. The next time Rails checks out that connection and tries to issue a query, the socket fails and you get `PG::ConnectionBad`. That isn't a connection pool bug. It's a layer-mismatch.
## Why a rollout is the awkward case
PgBouncer is a stateful proxy, and rolling it without losing in-flight work is harder than rolling a stateless web tier. Rolls happen often: configuration changes, node draining for autoscaler activity, image bumps for security patches, taints from cluster maintenance, every deploy of the proxy itself. None of these are rare events. If a rollout costs you a spike of `PG::ConnectionBad` every time, you're paying that cost weekly.
The Kubernetes mechanics are clean enough. New pods come up, the service stops sending new traffic to old pods, and Kubernetes sends `SIGTERM` to the old pods after the readiness flip. The problem is what `SIGTERM` means to PgBouncer.
PgBouncer responds to `SIGTERM` by entering a state called `WAIT_FOR_CLIENTS`[^2]. It stops accepting new client connections, lets in-flight transactions complete, and waits for existing clients to disconnect on their own. If the clients are well-behaved and disconnect quickly, the pod terminates cleanly. If the clients aren't well-behaved, and Rails workers aren't particularly well-behaved here because they have no reason to disconnect, the pod sits in `Terminating` state until Kubernetes loses patience and sends `SIGKILL` after `terminationGracePeriodSeconds`. That sever is exactly the `PG::ConnectionBad` spike you were trying to avoid.
The other shutdown signal, `SIGINT`, behaves differently. PgBouncer enters `WAIT_FOR_SERVERS`, finishes any in-flight transactions on its backend connections, and then actively disconnects every remaining client. Faster shutdown. No `SIGKILL` risk. But the active disconnection is itself the failure mode you wanted to avoid: any application thread that's mid-request between two queries will see its connection severed, and the next query fails with the same `PG::ConnectionBad`.
You can build either of these. Most teams running PgBouncer have variants of both lying around. Neither is enough on its own.
The reason neither is enough is the same in both cases: the client isn't participating in the rollout. The client doesn't know PgBouncer is rotating. The client believes the connection is fine until it discovers the connection isn't. The shutdown approach is trying to fix this from the proxy side, which is the wrong side.

This isn't a gap I diagnosed alone. PgBouncer's maintainers have been clear about it. On the GitHub thread for zero-downtime pod rotation[^6], a project contributor put it bluntly: "unfortunately there is not much pgbouncer can do to solve this. There is a patch [to add this functionality to the protocol] but it will be awhile before it gets merged, released, incorporated into drivers, etc." The maintainer's recommended workflow includes the line "and then all your clients should reconnect," with no mechanism for actually getting them to. The proposed fix lives at the Postgres protocol level and hasn't shipped, in PgBouncer or in any client driver. Until it does, the client side has to fill the gap.
## The missing piece is in the client

The fix is to make the client recycle its own PgBouncer connections on a schedule, before PgBouncer ever needs to rotate.
Concretely: every connection in the ActiveRecord pool gets a birth time stamped on first checkout. On every subsequent checkout, the pool checks the connection's age. If the age exceeds a configurable maximum lifetime, the pool removes the connection from the pool, closes the underlying socket, and checks out a fresh one. The fresh one gets routed by the Kubernetes service to whichever PgBouncer pod is currently healthy, which over time means traffic naturally redistributes off any pod that's about to be terminated.
End-to-end, a query lifecycle with the patch in place looks like this:
```mermaid
sequenceDiagram
participant App as Rails handler
participant Pool as ActiveRecord pool
participant Sock as TCP socket
participant PB as PgBouncer pod
participant DB as Postgres backend
App->>Pool: lease_connection (per query)
Note over Pool: check connection age vs MAX_LIFETIME
alt connection too old
Pool->>Sock: disconnect (recycle)
Pool->>Sock: open fresh socket
Note over Sock: K8s service routes the new TCP to a healthy pod
end
Pool-->>App: connection
App->>Sock: send SQL
Sock->>PB: forward
PB->>DB: assign backend (transaction-mode)
DB-->>PB: result
PB-->>Sock: bytes back
Sock-->>App: result rows
App->>Pool: check in
```
The lifetime check is the only piece outside what Rails already does. Everything else (per-query lease in 7.2+, the K8s service routing TCP on connect, PgBouncer's transaction-mode pooling) is stock behaviour.
Rails was the ecosystem holdout on this. Go's [`pgxpool`](https://pkg.go.dev/github.com/jackc/pgx/v5/pgxpool#Config) has had `MaxConnLifetime` (and `MaxConnLifetimeJitter`) for years. Python's [`psycopg_pool`](https://www.psycopg.org/psycopg3/docs/api/pool.html) has `max_lifetime`. Both ship the recycle-stale-connections pattern in the standard pool. Rails 7.x doesn't, so I shipped it as a small `prepend` patch on `ActiveRecord::ConnectionAdapters::ConnectionPool`. Rails 8.1 has since landed the same idea in core as a [`max_age`](https://api.rubyonrails.org/classes/ActiveRecord/ConnectionAdapters/ConnectionPool.html) connection-pool option[^4], with `pool_jitter` to avoid every connection in the fleet recycling at exactly the same wall-clock instant. The in-core implementation retires connections at check-in rather than at check-out, but it addresses the same root cause. If you're on 8.1, the patch below is one less thing to maintain. For everyone still on 7.x, this is what I ran[^7]:
```ruby
module ConnectionMaxLifetime
MAX_LIFETIME_SECONDS = ENV.fetch("CONNECTION_MAX_LIFETIME_SECONDS", "480").to_i
def checkout(*args)
connection = super
return connection unless MAX_LIFETIME_SECONDS > 0
now = Process.clock_gettime(Process::CLOCK_MONOTONIC)
unless connection.instance_variable_defined?(:@birth_time)
connection.instance_variable_set(:@birth_time, now)
end
age = now - connection.instance_variable_get(:@birth_time)
return connection if age <= MAX_LIFETIME_SECONDS
remove(connection)
connection.disconnect!
checkout(*args)
end
end
ActiveRecord::ConnectionAdapters::ConnectionPool.prepend(ConnectionMaxLifetime)
```
Two things make this work in practice. The first is Rails 7.2's move to per-query connection leasing[^3]. In earlier Rails, the connection was checked out at the request boundary and held for the whole request. A long request would mean a stale connection wouldn't get the lifetime check until the request finished. With per-query checkout, every query inside a request gets the lifetime check, which means stale connections get recycled mid-request, transparently.
The second is the interplay with `idle_timeout` (which Rails uses to reap unused pool entries, default 300s in 7.2+) and the default `reaping_frequency`. Idle connections age out of the pool naturally. The lifetime patch handles the in-use ones. Together, no client connection lives longer than `MAX_LIFETIME + idle_timeout`, regardless of traffic shape.
The PgBouncer side gets one configuration: a `terminationGracePeriodSeconds` long enough to cover the worst case. With that math right, the rollout behaves cleanly. PgBouncer receives `SIGTERM`, enters `WAIT_FOR_CLIENTS`, and waits. New client connections route to the new pods (Kubernetes service does this for free once the old pod is `Terminating`). Existing client connections age out one by one, either via the lifetime patch on their next checkout, or via `idle_timeout` if they go idle long enough. By the time the grace period is up, no client is still holding a connection to the old pod. PgBouncer exits cleanly. No `SIGKILL`, no severed sockets, no `PG::ConnectionBad`. A rollout that used to spike connection errors goes to zero.
## Tuning the timing math
The whole approach hinges on one inequality:
```
terminationGracePeriodSeconds > MAX_LIFETIME + idle_timeout + buffer
```
If the inequality holds, every existing client connection has time to recycle (either via the lifetime check on its next checkout, or via the idle reaper) before Kubernetes loses patience and sends `SIGKILL`. If it doesn't hold, `SIGKILL` severs whatever connections didn't make it out in time, and you're back to the original `PG::ConnectionBad` spike on every rollout.
A reasonable starting point for a Rails web tier:
- `MAX_LIFETIME`: 8 minutes (480s)
- `idle_timeout`: 5 minutes (300s, Rails 7.2+ default)
- buffer: 2 minutes (120s) for TCP close handshakes, kernel cleanup, the worst-case in-flight transaction
- `terminationGracePeriodSeconds`: 15 minutes (900s)
Most pods drain in three to five minutes in practice, because traffic is spread across the fleet and most connections see a fresh checkout well within `MAX_LIFETIME`. The fifteen minutes is the headroom for the unlucky long-tail connection that just got checked out as PgBouncer started shutting down.
The other side of the inequality is the rolling-update behaviour. Kubernetes uses `maxSurge` and `maxUnavailable` to control how many pods rotate at once, and a Pod Disruption Budget with `minAvailable: 1` keeps at least one PgBouncer pod always serving. As soon as an old pod enters `Terminating`, the K8s service stops sending it new connections (modulo a brief endpoint-propagation lag, which is why the standard pattern includes a `preStop` sleep of a few seconds before SIGTERM actually fires). Every fresh connection from a recycled client lands on a healthy pod that isn't about to be terminated. By the time the grace period expires, traffic has fully shifted to the new generation of pods and the old pod can exit cleanly.
One refinement worth knowing about: with a fixed `MAX_LIFETIME`, every connection that started around the same time tends to expire around the same time, which produces a brief spike in connection-establishment when they all recycle in a window. Rails 8.1's `pool_jitter` setting handles this in core. The patch above can do the same with `MAX_LIFETIME * (1 + rand(0.0..0.2))` per connection, spreading the recycle over a window instead of concentrating it.
There's a parallel knob on the PgBouncer side worth knowing about. `server_lifetime` (default 3600s) is the same idea applied to backend connections from PgBouncer to Postgres. PgBouncer recycles a backend the next time it's released after that age. Different layer, same trick. The PgBouncer config docs are consistent with the client-side approach: they note that `client_idle_timeout` should be set larger than the client-side connection lifetime, which assumes such a thing exists on the other end.
## What this gets you, and what it doesn't
What this gets you is zero connection errors during PgBouncer rollouts, every rollout, with no application-side retry logic to maintain. The cost is a slower rollout (you're paying the full `MAX_LIFETIME + idle_timeout` window, which can be ten to fifteen minutes per pod in practice) and the discipline of keeping the timing math in sync between the client and PgBouncer's grace period.
What it doesn't handle is any case where a single thread holds the connection for longer than the lifetime, and there's an important exception to call out: Rails 7.2's per-query checkout does NOT apply inside a transaction[^5]. Inside a `Model.transaction do ... end` block the connection is pinned to the thread for the duration of the transaction, every query reuses the same connection, and the lifetime check fires at checkout time only. So if a transaction runs for ten minutes and the lifetime is eight, the lifetime check never fires during those ten minutes. Same for any session-scoped state that has to live on a specific connection: `pg_advisory_lock`, session GUCs, prepared statements not configured for transaction-mode pooling. A long-running job that holds a transaction or an advisory lock blocks the lifetime check entirely. When PgBouncer terminates and the grace period expires, that connection gets severed and the job's next query fails.
PgBouncer offers one partial mitigation, `idle_transaction_timeout`, which forces a connection closed if it sits idle inside a transaction for too long. That helps with the idle-in-transaction case (a thread that opened a transaction and went off to do something else), but it doesn't help with a transaction that's actively running queries the whole time.
Two reasonable ways come up. One is to keep long-running jobs off PgBouncer entirely, with a separate `database.yml` entry pointing directly at the database, used by the relevant job classes. This is what advisory-lock-using code paths and migration runners need anyway, since transaction pooling can't safely route either.
The other approach is to wrap the failure path in transparent retry logic at the ActiveRecord adapter level. If a query fails with `PG::ConnectionBad` and the failure isn't inside an open transaction, retry the query on a fresh connection. The "not inside an open transaction" guard is the safety. A connection severed mid-transaction means Postgres has already rolled the transaction back, and retrying a single statement from inside that transaction would execute it outside the transaction context, which is unsafe. Retry only when the failure is between transactions. Web requests handle the in-transaction case naturally because the request returns 500 and the client retries. Jobs need an in-process retry layer specifically for the between-transaction case so they don't get re-enqueued for an error that resolves in milliseconds.
Neither approach is wrong. Both come up in practice. Most production Rails apps end up with some mixture: long-running batch jobs go direct, the bulk of web traffic and short jobs go through PgBouncer with the lifetime patch.
## What about PgBouncer's deployment shape
PgBouncer is one binary, but how you run it on Kubernetes shapes the rollout story as much as the configuration. Three patterns come up:
**DaemonSet** (one PgBouncer per node, applications connect to `localhost:6432`): preserves locality, no extra network hop. Doesn't scale horizontally because the pool size is fixed per node, and rollouts are slow because every node has to drain in turn. Each PgBouncer instance has its own backend pool, so total connections to Postgres scale with node count rather than actual demand. For small clusters, fine. For anything past a few dozen nodes, the inefficiency starts showing.
**Sidecar** (one PgBouncer per application pod): maximum isolation, one backend pool per app pod. Defeats the point of pooling because you've now got hundreds of small pools instead of one big one. Mostly an anti-pattern.
**Deployment + ClusterIP service** (centralized PgBouncer pool, autoscaled, fronted by a Kubernetes service): the pattern most production setups settle on. One logical PgBouncer that scales horizontally on CPU or connection metrics. TCP connections are inherently sticky (once a client connects to a particular pod, all traffic stays there until the connection closes), so the service load-balances on connection establishment, not per-query. Rolling updates are clean if you've got the lifetime patch in the client. Pod Disruption Budgets keep at least one pod available during voluntary disruptions, anti-affinity spreads pods across nodes for failure isolation, and HPA or KEDA scales the fleet up under load.
The Deployment + service pattern is what you want past hobby-project scale. The lifetime patch above is what makes it operationally clean.
## Other things PgBouncer ends up doing
Connection pooling is the primary job, but once you have PgBouncer in the path, a few other capabilities come for free.
**Pause and resume for maintenance windows.** PgBouncer's admin interface includes `PAUSE` and `RESUME` commands. `PAUSE` stops PgBouncer from forwarding queries to Postgres and waits for in-flight transactions to complete. The application keeps its connections open to PgBouncer, which now buffers them. This is useful during Postgres failovers and certain DDL operations that need a quiet moment, with the application none the wiser. `RESUME` flushes everything that queued up.
**TLS termination.** PgBouncer can speak TLS to the application and plaintext to Postgres, or vice versa. Useful when the application is on the other side of a network boundary and the database is on the same trusted network as the proxy, or the inverse.
**Multi-database routing.** The `[databases]` section in `pgbouncer.ini` lets one PgBouncer instance front many logical databases, mapping client connection strings to backend hosts and database names. A single proxy fleet can serve a primary, a read replica, multiple databases, and even databases on different hosts. This is the lever that makes "centralised PgBouncer for the whole org" practical.
**Authentication proxy.** PgBouncer can authenticate clients on its own without forwarding the credentials to Postgres, which keeps the real database password hidden inside the cluster.
**Per-user, per-database configuration.** Different pool modes, pool sizes, and connection limits per user or per database. Useful when you have a mix of long-running batch jobs and short transactional queries against the same database, or when you want service-level metrics on shared infrastructure.
What PgBouncer doesn't do, despite how often it gets asked, is read/write splitting on its own. PgBouncer doesn't inspect queries to decide whether they're reads or writes. The standard pattern when you want read/write splitting is to deploy two PgBouncer fleets, one in front of the primary and one in front of the read replica, and have the application route by connection target. PgCat does this natively if you'd rather have it in the proxy.
## Other ways to solve the same problem
Connection pooling is a real problem, and PgBouncer is one of several answers. A few worth knowing:
**AWS RDS Proxy** is a managed connection pool from AWS. Trade-off: it costs per vCPU per hour and adds a network hop. Prepared statement support is partial. Extended-protocol prepared statements are multiplexed (a recent improvement). The older `PREPARE` / `DEALLOCATE` / `DISCARD` text-protocol commands still cause connection pinning, which defeats pooling for the duration. Worth it if you don't want to operate a proxy yourself and your application uses the extended protocol (the default for most ORMs, including Rails). Cost climbs quickly with multiple databases since each one needs its own proxy instance.
**PgCat** is a Rust rewrite of PgBouncer with first-class sharding support and better multithreading. Less mature, smaller community, but a serious project worth tracking if you're hitting PgBouncer's single-threaded ceiling.
**Application-side pooling only** (no proxy at all) is viable if your application fleet is small enough that the total connection count stays inside Postgres's limits. The per-process Rails pool is well-engineered. You don't need PgBouncer until you do, and "until you do" is usually somewhere around the point where a single app fleet outgrows what one Postgres instance can host as direct connections.
**Pgpool-II** is the older alternative. Powerful but operationally heavier, with replication and load-balancing features that often aren't needed.
For most Rails-on-Kubernetes setups past a few dozen worker pods, PgBouncer is the right answer. The choice isn't usually "PgBouncer or something else." It's "PgBouncer with the missing client-side pieces or PgBouncer with a recurring rollout spike."
## Closer
If you're running PgBouncer on Kubernetes and the rollout spike is something you've learned to live with, try the lifetime patch. The implementation is small, the operational gains are large, and the trade-offs (slow rollouts, timing math) are honest. It's been running cleanly in production for me, and the rollout-spike alert has been silent since the patch landed.
For the SQL-side perils of running PgBouncer (transaction-pooling gotchas around prepared statements, advisory locks, statement timeouts, listen/notify), JP Camara's [PgBouncer is useful, important, and fraught with peril](https://jpcamara.com/2023/04/12/pgbouncer-is-useful.html) is the canonical companion read. He covers what to watch for inside the SQL layer. This post covers what to watch for at the rollout layer.
If you've worked through something similar with a different shape, or hit a failure mode I didn't, I'd love to hear about it. [maria@runbookpages.com](mailto:maria@runbookpages.com). Wrong-turns and what-broke stories most welcome. The closer to "tried this, here's what actually shipped" the better.
[^1]: PgBouncer documentation, [*pool_mode*](https://www.pgbouncer.org/config.html#pool-mode). The canonical reference for the session/transaction/statement contract and the SQL features each one breaks.
[^2]: PgBouncer documentation, [*Signals*](https://www.pgbouncer.org/usage.html#signals). SIGTERM puts PgBouncer into the same `SHUTDOWN WAIT_FOR_CLIENTS` state available via the admin console (the named admin command), and SIGINT triggers `WAIT_FOR_SERVERS`. A second signal escalates to immediate shutdown. Note this graceful-SIGTERM behaviour is PgBouncer 1.23+. Pre-1.23, SIGTERM was an immediate shutdown.
[^3]: [Rails 7.2 release notes](https://guides.rubyonrails.org/7_2_release_notes.html), *Per-query connection leasing*. Connections are leased for the duration of a single query rather than the whole request, which makes mid-request connection recycling possible.
[^4]: [ActiveRecord ConnectionPool API](https://api.rubyonrails.org/classes/ActiveRecord/ConnectionAdapters/ConnectionPool.html), *max_age*. Rails 8.1 ships connection-age retirement on the check-in path, complemented by `pool_jitter` (randomises expiry to avoid thundering-herd recycling), `idle_timeout`, and `keepalive`. The shape is different from the check-out patch but the goal is the same.
[^5]: Rails ConnectionPool, transaction pinning. Inside an open transaction the pool tracks the connection as pinned to its thread (`@pinned_connection` / `@pinned_connections_depth`) and skips the per-query lease/release cycle. The same connection is reused for every query in the transaction. This is necessary because Postgres transactions are connection-scoped and can't survive a connection swap mid-transaction.
[^6]: PgBouncer GitHub issue [#1468](https://github.com/pgbouncer/pgbouncer/issues/1468), *Zero downtime on PgBouncer Pod Rotation*. Maintainer and contributor responses confirm there is no proxy-side mechanism to gracefully tell clients to reconnect during rotation. The proposed protocol-level fix (a Postgres protocol extension) hasn't shipped in any driver as of writing.
[^7]: Prior art on the patch shape: Samuel Cochran's [ActiveRecord Connection Lifetime gist](https://gist.github.com/sj26/c2e999b4773b5c72b7421454867267c9), motivated by autoscaling rebalance rather than rotation drain. Same checkout-time recycle pattern, different reason to reach for it. The Rails 8.1 `max_age` work in core was driven by similar autoscaling concerns and lands on the check-in path.
---
# Post: When config edits start feeling like deploys
URL: https://runbookpages.com/posts/configmap-dynamic-event-driven
Published: 2026-04-26
Tags: rails, kubernetes, configmap, platform
> How to add dynamic configuration to hot, frequently-read request-path code in a Rails-on-Kubernetes app, without restarting any worker. Propagating config edits across the fleet via ConfigMap as an event channel: the alternatives I considered, the shape I shipped, and why most of the design was about what I kept out of the channel.

A rollout is misbehaving. An operator opens the internal dashboard and pauses it. The UI flashes green. They come into the engineering channel and ask the question that makes everyone sit up:
> is this actually applied yet?
The honest answer is: probably, in another thirty seconds, on most of the fleet.
That answer is fine on a quiet day. During an incident it falls apart. The value they edited lives in a database row, and a hundred application worker processes have that row cached in memory. Cache TTL is what's between "save click" and "everyone sees the new value." This post is about how I got from "thirty seconds, mostly" to "yes, everywhere, within a second" without making the database the read path. Several alternatives sat on the whiteboard before I picked a direction, and the part that finally made the design feel right was less about the channel I picked and more about what I deliberately stopped putting in the channel.
## The kind of config I'm talking about
Specifically: a rollout-allocation system (which variant does this user see for a given product change?) and a feature-toggle registry (is X currently on?). Both live as ordinary database rows. Both are read on every request through nested service calls. A hundred lookups per request isn't unusual. So the data has to be in process memory. Touching the database on the read path was off the table from day one.
What I wanted: writes hit the database. Every running process eventually reflects the new value. That "eventually" needs to be about a second across the fleet. If a save says "saved," every worker either converges or the save fails loudly. Inconsistent fleets where nobody knows it's inconsistent are the worst possible outcome. People stop trusting fast paths the moment they catch one lying.
A handful of properties shaped every alternative I weighed:
- The database is the only source of truth. Not a side cache, not a sidecar, nothing else.
- The read path stays in process memory.
- The propagation channel either delivers reliably, or fails loudly when it doesn't.
- No new piece of distributed infrastructure to keep alive if avoidable.
One framing note before I get into the alternatives. The specifics below are Rails on Postgres because that's what I built this on, but the bones of the design aren't Rails-specific. The structural requirements are a transactional commit hook on the database side, an in-process cache, and a Kubernetes client that supports the watch protocol. Watch-capable clients are mature in Go (client-go and controller-runtime, by far the best-documented and the reference implementation everyone else borrows from), Python, Java, and Rust. If you're on Django, a Spring service, or a Rust monolith, the same shape transposes and the framework name-drops below are scaffolding.
## Approaches I considered
### Periodic polling
The simplest answer. Cache the records in process memory and periodically refresh from the source on a timer. No new infrastructure, no propagation channel to operate. The dealbreaker for the shape I needed is the freshness floor. The convergence window is bounded by the TTL by construction, so making a config edit feel like a button click means a TTL of seconds, and a TTL of seconds means every pod hits the source on every refresh, mostly to rehydrate things that didn't change. The wider the fleet, the larger the load floor created by the polling itself. Polling is a legitimate answer when "minutes-fresh" is the right answer for the workload. It isn't here.
A variant I briefly weighed was caching in Redis as a layer between Postgres and the application processes, with the application polling Redis instead of Postgres. That moves the load off the primary, but the freshness vs load tradeoff is fundamentally the same. You've just bought yourself a second cache to invalidate.
### Push via Redis pub/sub
If polling is the problem, pushing is the answer. Publish a "this changed" event from `after_commit`, every subscribed worker refreshes. Sub-second propagation in the happy path, lightweight to add to a stack that already runs Redis. The Redis documentation is also explicit about what it gives you: pub/sub is fire-and-forget, [at-most-once delivery](https://redis.io/docs/latest/develop/interact/pubsub/)[^1]. No persistence, no acknowledgment, no replay. A worker that's between subscriptions when a publish goes out misses it. A network blip lasting a few seconds drops every message published in that window with no error and no metric on the subscriber side. Pub/sub is a fanout primitive, not a state-synchronization primitive. For "every node converges on the latest value" you want either a channel with replay (Redis Streams, a durable queue) or a channel whose unreliability is loud rather than silent. Pub/sub is neither, and the silent-staleness failure mode is the worst possible thing for an operator who needs to trust the propagation path during an incident.
### Vendor feature-flag platforms
A managed [feature-toggle](https://martinfowler.com/articles/feature-toggles.html) platform[^2] like LaunchDarkly, Flagsmith, or Unleash handles propagation for you, with SDK-based polling or event-driven updates from the vendor. They've grown well past their boolean-toggle origins, and most do support JSON payloads now. The harder problem is structural. Pushing the rollout-allocation records into a vendor's value field means signing up for a [dual source of truth](https://www.confluent.io/blog/dual-write-problem/) on purpose, with the database holding the canonical row and the vendor holding a serialized projection of it. The two are supposed to agree, but the moment two stores claim truth, the next incident is "wait, which one was actually right?" The same instinct underlies the older [Netflix-Archaius](https://github.com/Netflix/archaius) family of dynamic-config libraries. They're well built, but the problem they solve is broader than mine and the runtime layer carries flexibility I wouldn't use.
### A dedicated distributed config store (Consul, etcd, ZooKeeper)
Run a separate [coordination service](https://etcd.io/docs/latest/learning/why/) with watch APIs[^3]. The strongest version of "push, not poll." Watches are durable and replayable, the consistency model is well-defined (Raft on etcd, ZAB on ZooKeeper), and the read pattern matches what I wanted. The cost is operational. A new distributed system to keep alive, with its own backup story, upgrade story, network partition behavior, and on-call story. Production was already on Kubernetes, which means etcd was already in the picture, but as Kubernetes' backing store rather than something I could access directly. Reaching for a parallel etcd alongside the one Kubernetes was already running felt like the wrong shape for the size of the problem.
A related move I did make later, which is to use a Kubernetes object as the propagation channel and let the cluster's existing etcd carry the bytes. The next section is about how that landed.
## What I built
I picked Kubernetes ConfigMap as the propagation channel. ConfigMaps are stored in etcd, the control plane replicates them, and there are two ways to subscribe to changes from inside a pod: mount the ConfigMap as a volume of files and watch the filesystem, or talk to the Kubernetes API directly and use its [watch interface](https://kubernetes.io/docs/reference/using-api/api-concepts/#efficient-detection-of-changes)[^4]. Both are documented. I started with the volume-mount approach because it was the smaller change.
The publisher patches the ConfigMap from `after_commit` on the model. The subscriber, in each running worker, watches for changes and refreshes the in-process cache for the affected record. The first version mounted the ConfigMap at `/etc/config/...` and used the [`listen` gem](https://github.com/guard/listen) (already in the Gemfile via Rails) to react to filesystem events.
In a minikube proof-of-concept it worked. In real Kubernetes, two things broke it.
Latency came first. Volume-mounted ConfigMap updates aren't instant. The Kubernetes docs phrase the worst case as ["the kubelet sync period plus the cache propagation delay"](https://kubernetes.io/docs/concepts/configuration/configmap/#mounted-configmaps-are-updated-automatically)[^7], and on the default settings I was running the combination could stretch to a couple of minutes between the patch landing and the new file content showing up inside the pod. That was already worse than the polling baseline I had ruled out.
The symlink swap took longer to figure out. When kubelet updates a ConfigMap volume, it doesn't modify files in place. It writes them to a fresh timestamped directory and atomically swaps a `..data` symlink to point at the new directory (Kubernetes calls this [`AtomicWriter`](https://github.com/kubernetes/kubernetes/blob/master/pkg/volume/util/atomic_writer.go))[^8]. From inotify's perspective the user-visible file just got deleted (its old symlink target is gone), not modified. To handle this, your application has to interpret "deleted" as "atomically replaced," re-establish the watch on the new path, and not panic. I was watching for "deleted means deleted." So were the listener threads, which kept dying with bare "thread terminated" lines. I kept thinking it was memory pressure. The listen gem holds a persistent inotify file descriptor and a fiber pool, and in a busy worker that adds up. The actual cause was the listen gem's internal state being torn apart by the symlink flip every time kubelet did its sync.
I tried hardening the listener for a while. A supervisor thread that restarted on EACCES, a downgrade of the listen gem to an older version, more defensive event handling. I was hoping one of those would land. None of it stuck. The fix wasn't to harden the listen gem against ConfigMap semantics. The fix was to stop using filesystem-watching for this and use the Kubernetes API directly.
The [`kubeclient` gem](https://github.com/ManageIQ/kubeclient) was already in the Gemfile, used to patch the ConfigMap from the publisher side. The same gem exposes a watch interface that talks to `kube-apiserver` directly. Switching to it gave me structured `ADDED` / `MODIFIED` / `DELETED` events instead of filesystem deletes pretending to be modifications, a `resourceVersion` cursor for resuming after disconnects, and no kubelet sync delay. Events fire as soon as `kube-apiserver` accepts the change. The Kubernetes documentation explicitly endorses this pattern as one of the supported ways for an application to subscribe to ConfigMap changes. The same shape, in Go rather than Ruby, is what client-go calls a [Reflector](https://pkg.go.dev/k8s.io/client-go/tools/cache#Reflector) and what controller-runtime wraps as an Informer[^5].
One more design call inside the ConfigMap-based approach mattered more than the channel choice. Early on, I stored the full record JSON inside the ConfigMap, with each key being the record id and each value being the serialized row. The watcher pulled the whole payload out of the watch event and refreshed its cache without going back to the database. I kept asking myself why I was using the same store for two different jobs, the bell that says "something changed" and the database that says "here is the value." I narrowed the payload to a marker shape within a day, for two reasons.
The size argument came first. The [1 MiB ConfigMap size limit](https://kubernetes.io/docs/concepts/configuration/configmap/) Kubernetes documents and enforces is real, and with full record payloads the size budget shrinks faster than the entry count grows. A record might be a few hundred bytes today and a kilobyte tomorrow as a richer field gets added, and you can cross from "comfortable headroom" to "patches start failing" without anyone noticing. The failure mode would be nasty. The database write commits first, then `after_commit` fires, the ConfigMap patch fails with a 422, and from the dashboard's point of view the save succeeded while every running process kept the old value. The size headroom was real but finite and shrinking. The safer thing was to stop spending it on payload bytes.
The structural argument was the bigger one. By storing values inside the ConfigMap I'd given myself two sources of truth. The database had the canonical row. The ConfigMap had a serialized projection of it. The two were supposed to be identical, and most of the time they were, but the moment two stores claim truth, the next incident becomes "wait, which one was actually right?", and you find out about it by accident, which is the worst way to find out about anything.

The answer wasn't a bigger ConfigMap or validation between stores. The answer was that the ConfigMap shouldn't have been a store at all.
## Markers, not values
The shipped design is one sentence. The ConfigMap doesn't hold values. It holds markers.
A marker is the smallest thing that lets a subscriber answer two questions: "did this entity change?" and "since when?" For the rollout-allocation records, that's `{id, name, updated_at}`. For the feature-toggle records, the marker carries one extra field, the boolean state, because the toggle's whole truth is a name and a bit and copying the bit into the marker is a verbatim copy of the row rather than a serialized projection that can drift.
The database stays the source of truth. The ConfigMap is the bell. When the bell rings, every running process walks back to the database, asks what changed, and updates its cache. If you've worked with event-driven invalidation before, you'll recognise the shape: this is Martin Fowler's [Event Notification](https://martinfowler.com/articles/201701-event-driven.html#EventNotification) pattern, where the event is a thin "something happened" signal and the consumer fetches the actual state.
The publisher is two short methods. Build the marker, patch the ConfigMap with a single key in `data`. The `after_commit` hook is the trigger.
```ruby
# Called from after_commit on the model.
def marker_for(record)
{ id: record.id, name: record.name, updated_at: record.updated_at.iso8601 }
end
def broadcast!(record)
patch_body = { data: { "#{record.id}.json" => marker_for(record).to_json } }
kube_client.patch_config_map(configmap_name, patch_body, namespace)
end
```
The subscriber is even smaller. One thread per worker process opens a watch and reacts to events.
```ruby
# Runs in a long-lived thread; receives a watch event,
# diffs against the previous snapshot, refreshes per-record.
def apply_snapshot(data)
data.each do |key, content|
next if previous_snapshot[key] == content
cache.refresh_for(id_from(key))
end
self.previous_snapshot = data.dup
end
```
Worth noticing what the subscriber is doing in those four lines. Kubernetes watches deliver full objects, not field-level deltas: every watch event on the ConfigMap carries the entire `data` map, regardless of which single key was actually patched. The diff against the previous in-memory snapshot is what figures out which key in this event was actually different. Without it, every patch would invalidate every cached record on every pod, which collapses the whole point of doing this. The diff turns the firehose back into a per-record signal: one record changes, exactly one cache entry refreshes, on every pod, and untouched records stay warm. That per-record granularity is itself a design choice, not a free property of the channel. Each record gets its own key in the ConfigMap (`{id}.json`) rather than the dataset being collapsed into a single value. Pack everything into one key and the diff degenerates to "the blob changed" with no per-entity signal to recover. I benchmarked the diff step on its own and it landed in nanoseconds per event, which surprised exactly nobody. The `id_from(key)` step parses `"42.json"` back to `42`. The naming convention is the only thing tying a ConfigMap entry to a database row, which keeps the channel oblivious to the schema on the other side.
The interesting move isn't the ConfigMap, and it isn't the API watch. It's the refusal to put anything other than "this changed" into the propagation channel. Markers stay tiny (~100 bytes each), so the 1 MiB budget holds thousands of records before partitioning would matter. The database stays the only thing claiming truth. The dual-store class of bugs disappears entirely because there's only one store.
What keeps the budget bounded over time is that marker deletion is part of the lifecycle, not an afterthought. A record being deactivated upstream is a `delete` on the corresponding ConfigMap key, not a soft tombstone left in place. The marker count tracks the active-record count, not the lifetime-record count. Without that, even a tiny per-marker payload eventually fills 1 MiB on a long-enough-running system, and the design quietly turns into a partitioning problem you didn't sign up for.
In production code, those methods don't sit loose. They're override hooks on two base classes that own the kubeclient setup, the patch wrapping, and the watch loop with `410 Gone` recovery. A new record type added to the broadcast set is two short subclasses, one on each side.
```ruby
# Publisher base. Subclasses override marker_for and pass in the
# target configmap_name. The kubeclient setup, the patch wrapping,
# and the key naming convention live in one place.
class BasePublisher
def initialize(kube_client:, configmap_name:, namespace:)
@kube_client = kube_client
@configmap_name = configmap_name
@namespace = namespace
end
def broadcast!(record)
patch_body = { data: { key_for(record) => marker_for(record).to_json } }
@kube_client.patch_config_map(@configmap_name, patch_body, @namespace)
end
# Subclass overrides this.
def marker_for(record)
raise NotImplementedError
end
private
def key_for(record)
"#{record.id}.json"
end
end
```
The watcher base is where the operationally interesting code lives. The `run!` loop hydrates from a `LIST`, opens a watch from the resourceVersion the `LIST` returned, and re-LISTs whenever the watch tears down (including the routine `410 Gone` recycle). Subclasses override `refresh_for` to wire the cache for their record type.
```ruby
# Watcher base. Subclasses override refresh_for to wire the cache
# for their record type. LIST hydration, watch loop, 410 Gone
# recovery, and snapshot diffing all live here.
class BaseWatcher
def initialize(kube_client:, configmap_name:, namespace:)
@kube_client = kube_client
@configmap_name = configmap_name
@namespace = namespace
@previous_snapshot = {}
end
def run!
loop do
cm = @kube_client.get_config_map(@configmap_name, @namespace)
apply_snapshot(cm.data.to_h)
watch_from(cm.metadata.resourceVersion)
rescue Kubeclient::HttpError => e
sleep(error_backoff(e)) # 410 Gone or transient API error.
end
end
private
def watch_from(resource_version)
@kube_client.watch_config_maps(
namespace: @namespace,
resource_version: resource_version,
field_selector: "metadata.name=#{@configmap_name}",
).each do |event|
next unless %w[ADDED MODIFIED].include?(event.type)
apply_snapshot(event.object.data.to_h)
end
end
def apply_snapshot(data)
data.each do |key, value|
next if @previous_snapshot[key] == value
refresh_for(id_from(key))
end
@previous_snapshot = data.dup
end
# Subclass overrides this.
def refresh_for(id)
raise NotImplementedError
end
def id_from(key)
key.delete_suffix('.json').to_i
end
def error_backoff(error)
error.is_a?(Kubeclient::ResourceNotFoundError) ? 30 : 1
end
end
```
A concrete subclass is small enough that it isn't worth its own snippet: a `BasePublisher` subclass with `marker_for(record)` defined, a `BaseWatcher` subclass with `refresh_for(id)` calling into the appropriate cache, and a boot-time call to start the watcher thread from the worker process initializer. Everything else lives in the bases.
The flow end-to-end:
```mermaid
flowchart TD
UI[Dashboard] -->|save| DB[(Database)]
DB -->|after_commit| PUB[Publisher]
PUB -->|patch ConfigMap| KAPI[kube-apiserver]
KAPI --> CM[ConfigMap markers]
CM -->|WATCH event| W[Subscriber per worker]
W -->|read updated row| DB
W -->|refresh in-memory index| C[(Process cache)]
SVC[Request handler] -->|hot path| C
```
Each pod runs one subscriber thread per Puma worker process. That's a little redundant. Every worker on every pod opens its own watch stream against the same ConfigMap. The alternative is a sidecar or some intra-pod fanout, both of which add machinery I didn't want. Letting every process be responsible for its own correctness keeps the mental model simple.
## The RBAC shape
The publisher and the subscriber need different things from RBAC. The publisher needs `patch` and `get` on the specific ConfigMap, and RBAC lets you pin those verbs to a single `resourceNames` entry. The publisher can't touch any other ConfigMap, only this one. The subscriber needs `watch` and `list` on ConfigMaps, and here Kubernetes makes a choice you don't get to opt out of: [`list` and `watch` cannot be scoped by `resourceNames`](https://kubernetes.io/docs/reference/access-authn-authz/rbac/#referring-to-resources)[^6]. The verb applies at the kind level. So every subscriber pod has list/watch on every ConfigMap in its namespace.
```yaml
# Publisher: tight scope, single named resource.
- apiGroups: [""]
resources: ["configmaps"]
resourceNames: ["broadcast-channel"]
verbs: ["get", "patch"]
# Subscriber: list and watch are namespace-wide.
# resourceNames is silently ignored on those verbs.
- apiGroups: [""]
resources: ["configmaps"]
verbs: ["get", "list", "watch"]
```
That sounds worse than it is. The data on the wire is markers, not values, so a worker accidentally reading a neighbour ConfigMap learns nothing about anyone's data. The realistic mitigation, if anything sensitive lives in the same namespace, is to put the propagation ConfigMap in its own dedicated namespace. For a namespace whose other ConfigMaps are equally non-sensitive, the wide grant is acceptable. Worth naming, in any case. The asymmetry between named-verb scoping and list/watch scoping is one of those things you only learn when you write the Role and ask why the manifest is rejecting your `resourceNames` list.
Worth saying once, out loud: this whole pattern is for non-secret configuration. ConfigMap and Secret have nearly identical projection mechanics through kubelet, but only Secret is intended for sensitive data, and only Secret participates in the encryption-at-rest, RBAC norms, and audit treatment that credential-class material wants. If the value you're propagating is a secret, the answer is the same shape with a different resource type. Everything else in this post is about the non-secret case.
## What this gets you, and what it doesn't
Convergence in production sits around 250ms median, under two seconds at p99. End-to-end per-pod processing cost per propagation, the part the subscriber spends from receiving an event to having the cache slot refreshed, sits around 5-10ms. Most of that is the database round trip to fetch the changed row. The slowest path through the system is pod-restart catch-up, which is hydration-bounded rather than watch-bounded. A fresh pod does a `LIST` against the ConfigMap, builds its cache from the database for the relevant records, then opens a watch from the resourceVersion the list returned. The watch failure path collapses to the same operation. When `kube-apiserver` returns a `410 Gone` because the resourceVersion has aged out of the watch cache, the subscriber clears its cursor and re-hydrates. No special-case recovery code. Recovery is hydration plus a fresh watch.
What this doesn't give you is queue semantics. The Kubernetes watch is what I'm calling a convergence channel, not a delivery channel. Within a watch session, events arrive in resourceVersion order, and the list-then-watch pattern handles disconnects: when the watch returns `410 Gone`, the subscriber re-lists and re-establishes from the new resourceVersion. That's enough to converge on the latest value. It isn't enough for "I need exactly-once, in-order processing of every change." For that, reach for a real durable queue.
One more shape this isn't for: high-frequency writes. Every edit is a `PATCH` against `kube-apiserver`, which means an admission pass, an etcd write, and a watch fan-out to every subscriber pod in the namespace. That's fine at minutes-between-edits and survives bursts. It isn't the right channel for many-edits-per-second sustained throughput. ConfigMap is a control-plane object and the apiserver is the bottleneck. If the workload is "writes flow constantly through the channel," the right answer is a real broker, not the cluster's own coordination plane.
Three questions I'd want any design in this space to answer. What happens if a process restarts mid-stream? What happens if the signal is missed? Who owns the truth, and where in the code is that ownership enforced? The shape that holds is the one where the channel carries no truth, the source of truth never moves, and the recovery path collapses to the same operation as the boot path.
## Failure modes, old and new
The earlier alternatives each had a specific failure that ruled them out. How the shipped design fares against each:
- **Polling's freshness floor:** resolved. Convergence is sub-second.
- **Pub/sub's silent message loss:** resolved. The watch carries `resourceVersion` and re-lists on `410 Gone`, so a missed sequence surfaces as "this watch is too far behind, here's the current state" rather than as quiet drift.
- **Vendor feature flags' dual source of truth:** resolved. Markers, not values, means the database stays the only thing claiming truth.
- **A dedicated coordination service's operational cost:** resolved. The cluster's existing etcd carries the bytes through the Kubernetes API.
- **Volume-mount + `listen`'s kubelet sync delay and `AtomicWriter` symlink swap:** resolved. The watch interface fires the moment `kube-apiserver` accepts the patch.
What this design does add are two new failure surfaces, one on each side of the channel.
### Publisher side: the dual-writes window
The publisher fires from `after_commit`, which guarantees the database write is durable before the patch goes out, but the database write and the ConfigMap patch are still two writes to two different systems. A window exists between the commit and the patch where the network can blip, `kube-apiserver` can return a 500, or the worker process can OOM. When that window matters, the row is durable but the marker never updates, and no subscriber refreshes.
The basic shipped design makes this loud rather than silent without anything special. The `kubeclient` patch raises on non-2xx, the `after_commit` exception propagates up to the controller, and the dashboard shows a 500 instead of the cheerful "saved" flash. The operator reads "save failed" and retries. For the kinds of edits this design carries, a flag flip or a percentage change, the retry is naturally idempotent because the same row update plus the same marker patch will either both succeed or both fail again with the same error. The database state survives a failed retry intact because the commit already happened.
Two improvements I considered and didn't ship, in case your shape needs more than the basic loud-failure path:
- **Retry with backoff inside the `after_commit` block.** Catches transient network blips that resolve in seconds and spares the operator from seeing the flake. Trade-off: hides infrequent `kube-apiserver` issues you might want surfaced in error tracking.
- **A slow reconciliation loop** (every minute or two) that walks recently-updated rows and re-publishes any whose marker has fallen behind. Belt-and-suspenders if your subscribers can't tolerate the rare missed update. Costs a periodic scan and a definition of "stale enough to re-publish." Genuinely overkill for my workload, mentioned for shapes where the operator-retry path isn't enough.
### Subscriber side: a long-lived idle thread
Each subscriber is a Ruby thread blocked on a long-poll HTTP connection to `kube-apiserver`. In steady state the thread costs almost nothing. It sleeps in the kernel until the next event arrives, CPU is essentially zero, memory is one thread stack. The `410 Gone` recycle is the only non-quiescent activity: when the watch cursor falls behind the apiserver's watch cache, the subscriber re-LISTs and re-establishes from the new resourceVersion. For a low-churn ConfigMap like this one the recycle is rare. For higher-churn resources it can fire every few minutes, still effectively free.
The failure modes are the ones long-lived idle threads tend to have. The thread can die on an uncaught exception and stop watching forever. The HTTP connection can hang half-open after a network event without raising an error. The re-LIST after a `410 Gone` can itself fail. Each of these results in silent staleness on that one pod, with its cache no longer refreshing and no one knowing.
The mitigations are the standard set for long-lived consumers, none of them exotic:
- **Wrap the watch loop in a supervisor** that restarts the thread on uncaught exceptions. The same shape I tried with the `listen` gem (which didn't save it from `AtomicWriter`). Here it works, because the failures are real exceptions rather than the listen gem's torn-apart internal state.
- **Set a connection read timeout** so a half-open socket surfaces as an error rather than blocking forever. The supervisor then catches it.
- **Emit a "time since last successful event" metric per pod** and alert on the long tail. The one failure mode the supervisor can't see is the case where the thread is blocked but no events are arriving because the connection silently dropped without raising. The metric catches that.
For my workload, the operator-retry path on the publisher side was enough on its own. The reconciliation loop never earned its place.
It's been running in production for about six months now, happy and uneventful. No pages, no fire drills. The numbers above are steady-state observations, not best-case cherries. Whatever else might bite at this scale would have shown up already.
## See also
The two posts that build directly on this propagation channel: [tuning Rails log levels per class](/posts/per-component-log-levels-rails/) uses the same pattern at the per-class level (and explicitly cites this design in its "what I'd revisit today" section), and [per-user request-scoped log overrides](/posts/per-user-debug-logging-rails/) extends the same idea down to a single request. For a different shape of "the proxy can't tell its clients to reconnect, so the fix lives in the client," [rolling PgBouncer without dropped queries](/posts/pgbouncer-zero-downtime-rollouts/) walks the equivalent Postgres-side trap.
If you've worked through something similar, or hit a failure mode I didn't, I'd love to hear about it. [maria@runbookpages.com](mailto:maria@runbookpages.com). War stories most welcome. The closer to "tried this, here's what broke" the better.
*Related: dynamic configuration in hot request paths, runtime configuration without redeploys, read-mostly config invalidation, dynamic Kubernetes ConfigMap propagation, list-then-watch resourceVersion, kubelet AtomicWriter, event-driven cache invalidation, fleet-wide convergence, Rails after_commit propagation, RBAC list/watch scoping.*
[^1]: [Redis docs](https://redis.io/docs/latest/develop/interact/pubsub/), *Pub/Sub*. The page is direct about the contract: messages are delivered to currently-subscribed clients only, with no acknowledgment and no replay.
[^2]: Pete Hodgson, [*Feature Toggles (aka Feature Flags)*](https://martinfowler.com/articles/feature-toggles.html), on martinfowler.com. The canonical taxonomy of toggle types and the operational tradeoffs of vendor-managed flag platforms.
[^3]: etcd documentation, [*Why etcd*](https://etcd.io/docs/latest/learning/why/). A short articulation of what a coordination service buys you and where the line sits between an application database and a metadata store backed by a consensus protocol.
[^4]: Kubernetes API concepts, [*Efficient detection of changes*](https://kubernetes.io/docs/reference/using-api/api-concepts/#efficient-detection-of-changes). Documents the list-then-watch contract that the API exposes, the role of `resourceVersion`, and the `410 Gone` semantics that make recovery deterministic.
[^5]: client-go, [*Reflector* (godoc)](https://pkg.go.dev/k8s.io/client-go/tools/cache#Reflector). The reference implementation of list-then-watch in Go, wrapped by the higher-level Informer abstraction that controller-runtime builds on.
[^6]: Kubernetes RBAC docs, [*Referring to resources*](https://kubernetes.io/docs/reference/access-authn-authz/rbac/#referring-to-resources). The `resourceNames` field cannot apply to `list`, `watch`, or `deletecollection` verbs (or to `create`, since the object name isn't yet known), so wide grants are the only available option for those verbs.
[^7]: Kubernetes docs, *ConfigMaps*, section [*Mounted ConfigMaps are updated automatically*](https://kubernetes.io/docs/concepts/configuration/configmap/#mounted-configmaps-are-updated-automatically). Projected keys update on the kubelet's periodic sync plus an additional cache propagation delay that depends on `configMapAndSecretChangeDetectionStrategy` (watch propagation, TTL, or zero for direct API). On default settings the worst-case lag can stretch to minutes.
[^8]: Kubernetes source, [*pkg/volume/util/atomic_writer.go*](https://github.com/kubernetes/kubernetes/blob/master/pkg/volume/util/atomic_writer.go). The implementation kubelet uses to project ConfigMap and Secret volumes. The header comment describes the timestamped-directory write plus `..data` symlink swap that makes the update atomic from the consumer's perspective, and incidentally breaks any consumer watching the user-visible filenames for in-place modifications.
---